Legislative Auditor's Conclusion:

Washington State Patrol continues to use a vehicle life cycle cost model, but it is not following best practices. Vehicle replacement decisions should be based on a revised analysis and also consider other important factors.


September 2020

The Washington State Patrol (WSP) planned to spend $13.3 million to purchase and equip 240 new pursuit vehicles in the 2019-21 biennium

WSP planned to spend just under 50% of its 2019-21 pursuit vehicleStandard vehicles that are modified to perform under the rigors of police use. budget on capital costs, including purchasing new vehicles and equipment. It planned to spend $14.4 million on operating costs, such as fuel, maintenance, and parts.

Graphic showing planned spending during 2019-21 on Vehicle Purchases and Equipment ($13.3M) vs. Vehicle Maintenance and Operations ($14.4M)

The average replacement mileage in 2019 was 118,000

WSP conducts life cycle cost analysis to determine the optimal replacement mileage for the Ford Police Interceptor Utility (Interceptor), the agency's primary pursuit vehicle. According to the agency's analysis, the optimal replacement targetThe mileage interval where total life cycle costs per mile are lowest. for the Ford Interceptor is 110,000 miles for the 2019-21 biennium. In practice, WSP replaced Interceptors when they reached an average of 118,000 miles in 2019.

WSP is not following best practices for using life cycle cost analysis and communicating results. This limits the accuracy of the analysis and its impact on policy and funding decisions.

WSP purchased a new pursuit vehicle life cycle cost model in 2004 from the National Association of Fleet Administrators. WSP updates the data in its model every two years in advance of its biennial budget request. The results help to inform WSP's funding request for vehicle expenditures in the upcoming biennium.

JLARC staff found that WSP is not following best practices for updating and documenting life cycle cost analysis and communicating the results.

  • WSP provides limited oversight of data entry, leading to significant outliers and incomplete records. Better data could improve overall fleet management and increase the accuracy of the life cycle cost model.
  • The model does not follow standard modeling guidelines such as using consistent formulas or discounting costs to their present value. A coding error prevents the model from accurately displaying life cycle costs beyond 110,000 miles.
  • WSP did not adequately document the assumptions and methodologies used to update the 2019-21 life cycle cost model. As a result, JLARC staff were unable to verify the cost inputs in the model. In addition, WSP cannot accurately track how costs and other inputs have changed over time.
  • The narrative summary submitted to the Legislature lacked detail and did not include a copy of the 2019-21 life cycle model. This prevents legislative staff from reviewing and verifying the analysis that led to the 110,000 mile replacement target.

JLARC staff's analysis indicates an optimal replacement target of 130,000 miles. A replacement decision should also consider other important factors.

JLARC staff modified the structure and content of the model to align with available fleet data and incorporate best practices for life cycle costing. Based on the updated analysis, JLARC staff identified an optimal replacement range from 130,000 miles to 175,000 miles.

After adjusting for costs and factors not included in the model, JLARC staff determined an optimal replacement target of 130,000 miles.

Some of the other considerations include:

  • How vehicle downtime When vehicles are inactive due to maintenance work. effects the size of the fleet and trooper availability.
  • The level of uncertainty around maintenance costs and vehicle reliability at higher mileages.
  • The desire to keep the fleet up to date with the newest safety features.

Graphic showing life cycle cost per mile vs. replacment mileage highlighting that 130K is the lowest mileage within 1% margin of error and 175K as the mileage with the lowest life cycle cost per mile

Source: JLARC staff analysis of WSP fleet data.

Rising costs to purchase and equip vehicles may increase the optimal replacement mileage, though other future costs are less certain

WSP's transition from the Ford Interceptor to the Ford Interceptor EcoBoost, by itself, is expected to increase purchase costs by 11% in 2019-21. JLARC staff's analysis found that the additional costs could increase the optimal replacement target by as much as 16,500 miles. However, other costs that impact the optimal replacement mileage are less certain, such as maintenance on the new vehicle model.

Legislative Auditor Recommendations

The Legislative Auditor makes three recommendations to improve fleet management.

  1. WSP should improve the procedures and data systems it uses to collect and track vehicle maintenance data.
  2. WSP should establish and document procedures for conducting life cycle cost analysis each biennium.
  3. WSP should provide the Legislature with additional information on its life cycle cost analysis and pursuit vehicle budget when it submits its biennial budget requests.

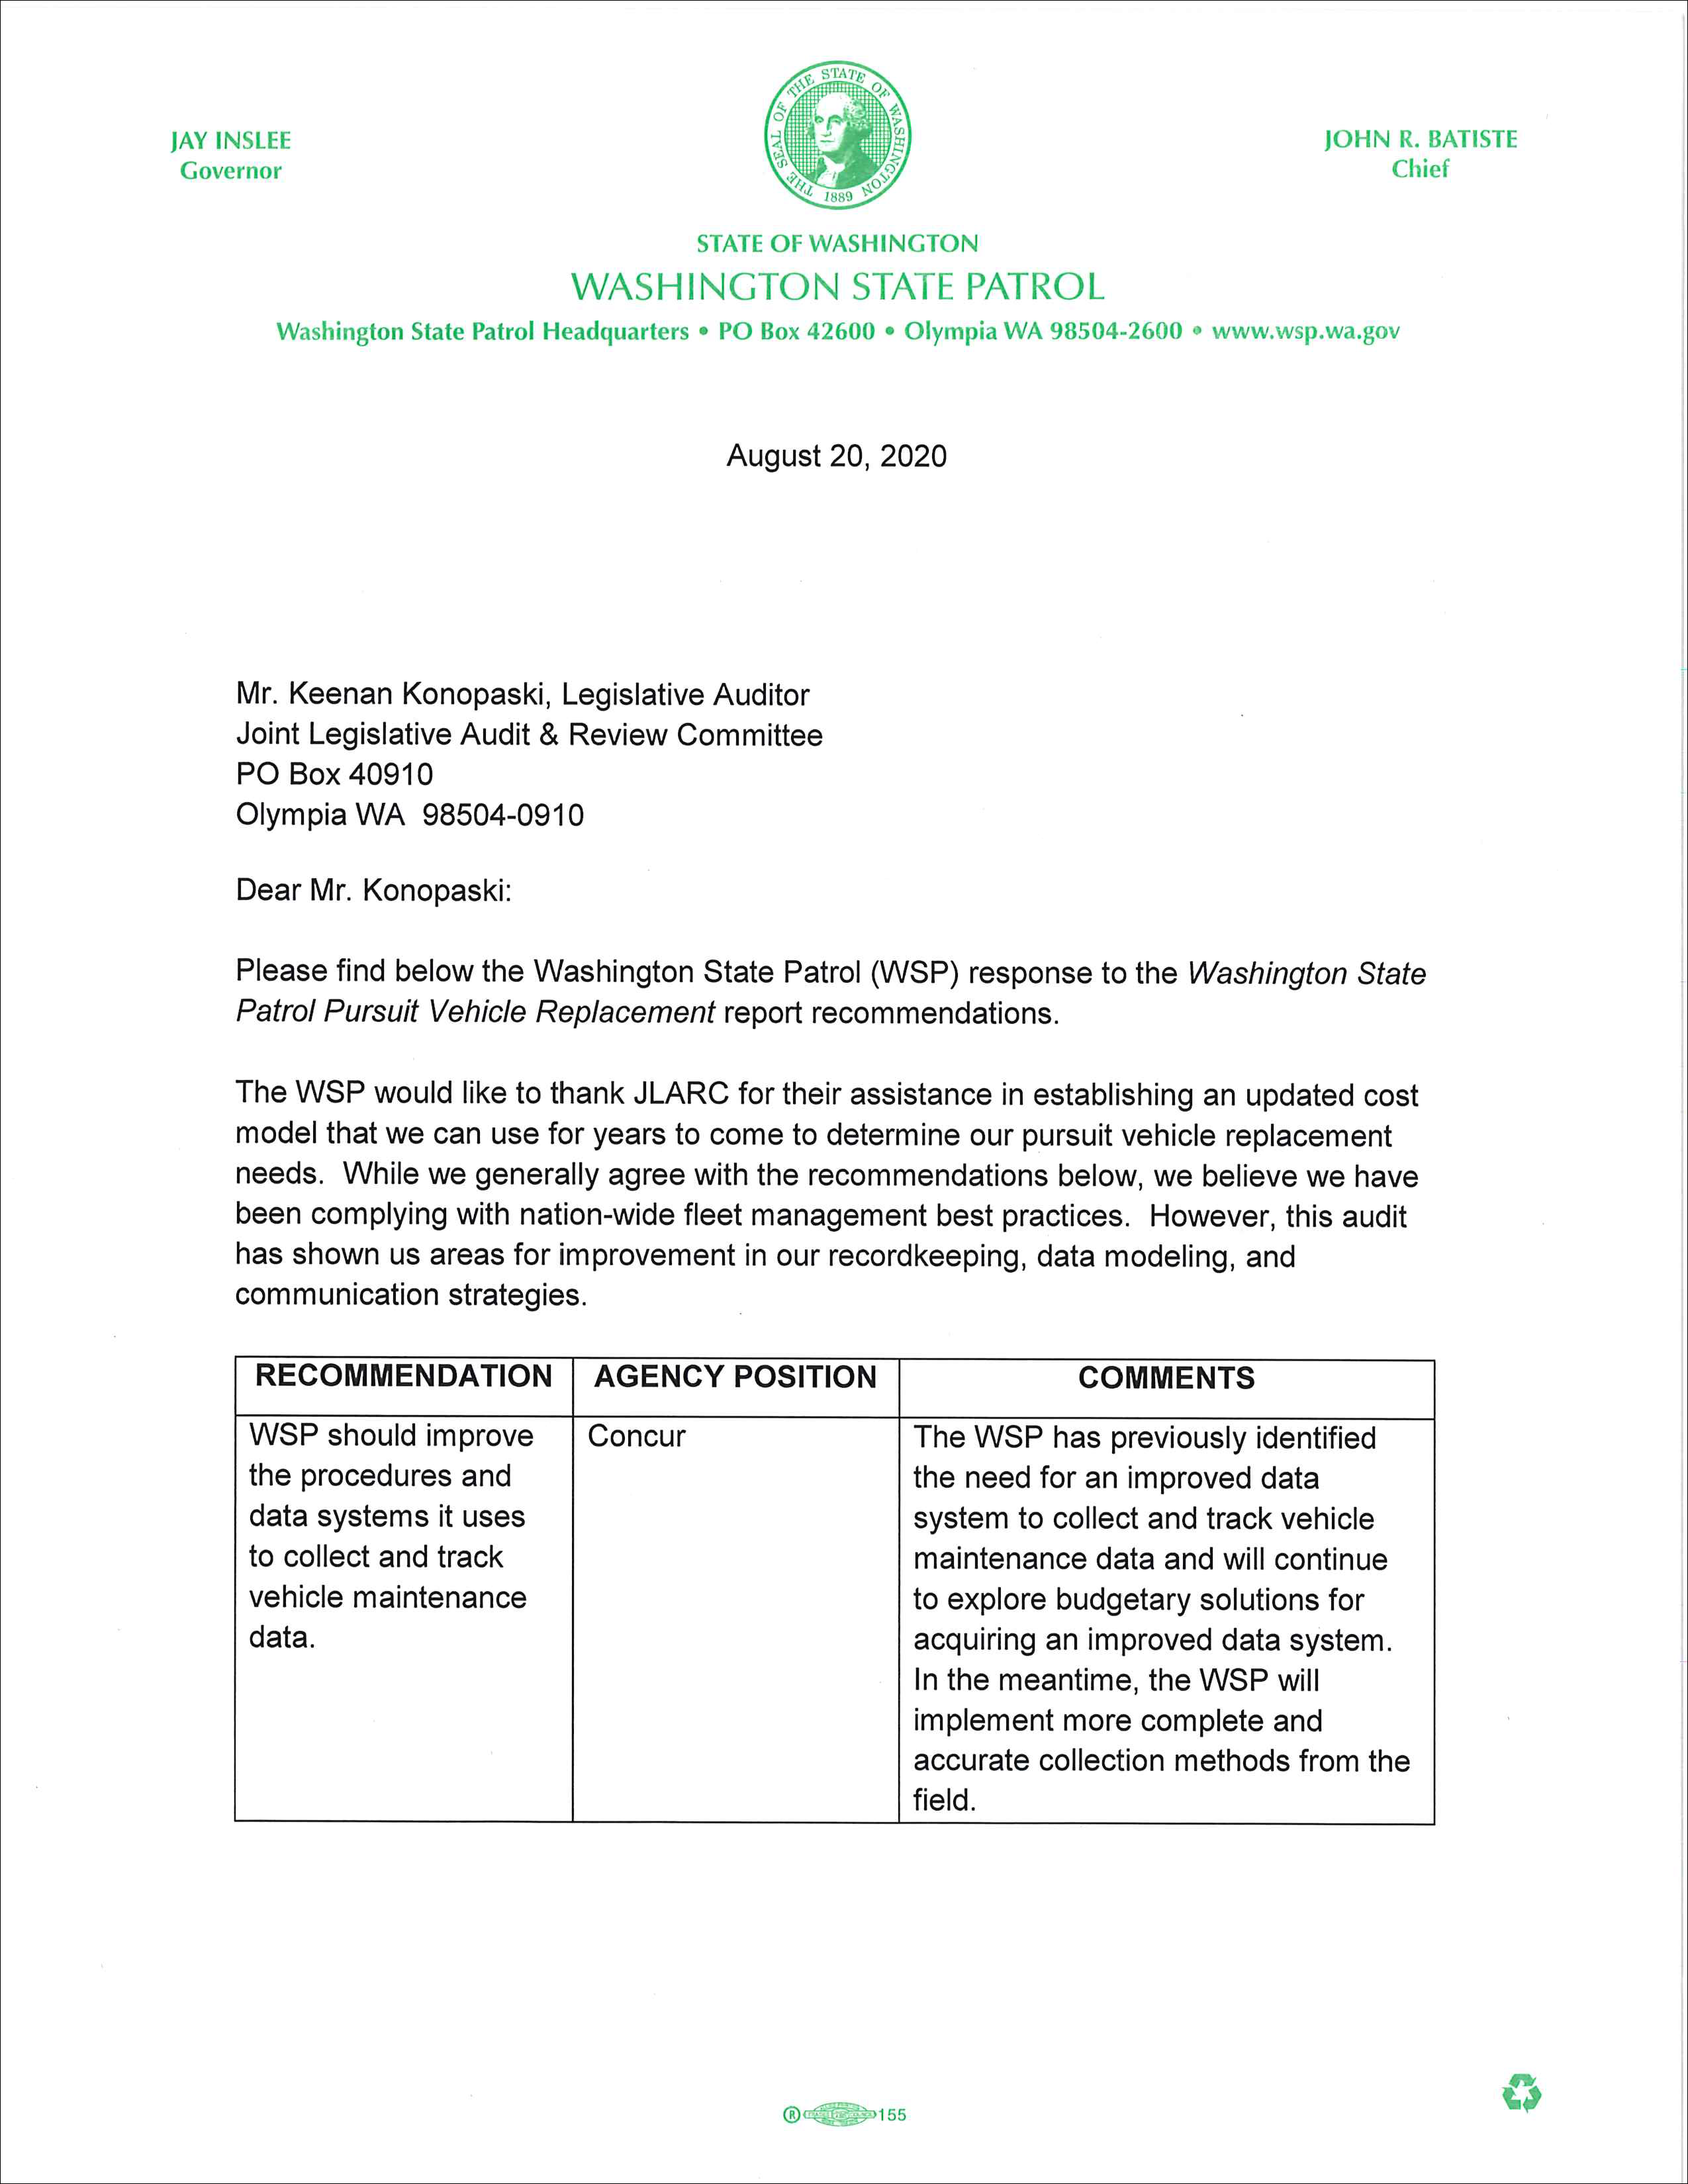
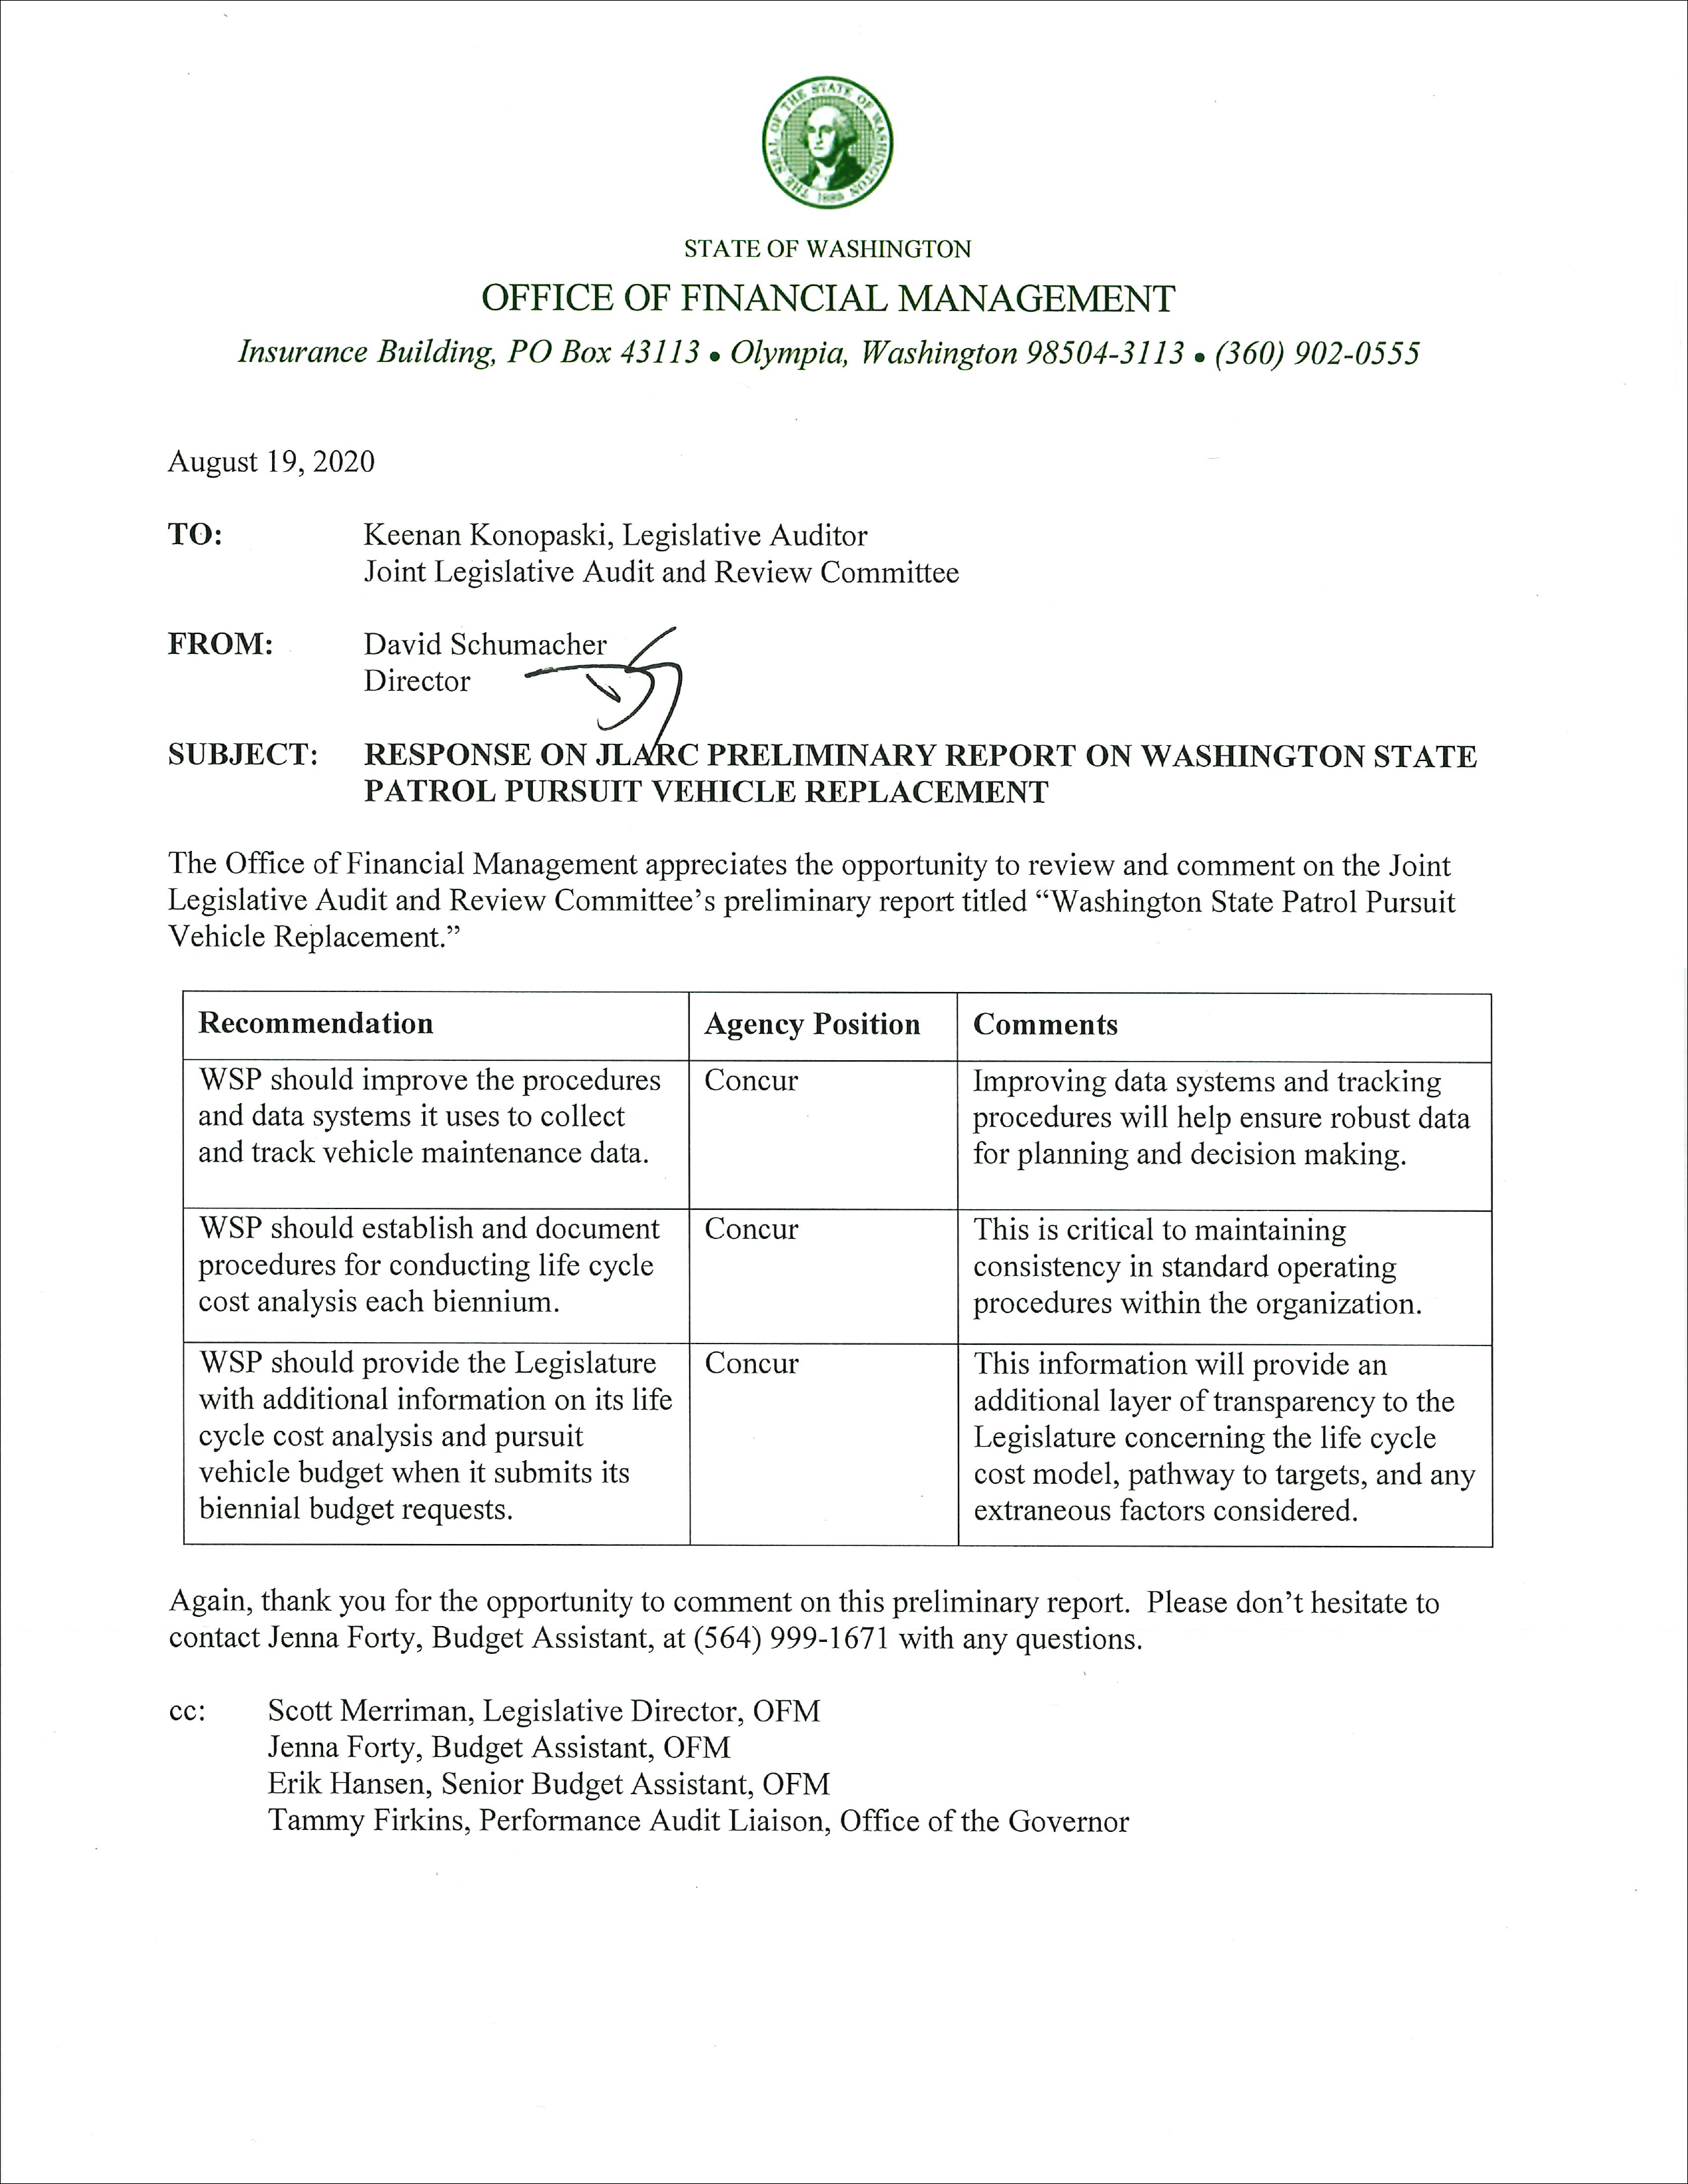
The Washington State Patrol and Office of Financial Management concur with these recommendations. You can find additional information in Recommendations.

Committee Action to Distribute

On September 30, 2020 this report was approved for distribution by the Joint Legislative Audit and Review Committee. Action to distribute this report does not imply the Committee agrees or disagrees with Legislative Auditor recommendations.

20-05 Final Report: Washington State Patrol Pursuit Vehicle Replacement

September 2020

Report Details

1. WSP planned to spend $13.3 million on 240 pursuit vehicles in 2019-21

The Washington State Patrol (WSP) planned to purchase 240 new pursuit vehicles during the 2019-21 biennium

WSP's Fleet Section manages over 1,500 vehicles

The Washington State Patrol (WSP) purchases and maintains its own vehicle fleet. The fleet includes 1,500 vehicles that the agency uses to perform a variety of functions. The focus of this report is pursuit vehicles.

Pursuit vehicles are standard vehicles that have been modified to perform under the rigors of police use. This includes enhanced braking and improved acceleration. Pursuit vehicles are primarily assigned to troopers and officers responsible for traffic and commercial vehicle enforcement.

WSP currently purchases four pursuit models: the Ford Police Interceptor Utility (Interceptor), the Chevy Tahoe, the Dodge Charger, and a BMW motorcycle. The Ford Interceptor is the primary pursuit model and accounts for over 70% of the pursuit vehicle fleet.

WSP re-assigns many of its older pursuit models to non-pursuit duty in its Crime Laboratory, Training, and Property Management divisions. Non-pursuit vehicles also include a number of civilian vehicles that are not modified for more rigorous use.

WSP's Fleet Section (Fleet) is responsible for managing all of the agency's vehicles. This includes:

  • Setting fleet policies and budgets: Fleet sets policies such as preventive maintenance schedules and repair expenditure limits. Fleet is also responsible for updating a pursuit vehicle life cycle cost model and determining vehicle replacement targets.
  • Procuring vehicles: Fleet purchases vehicles and equipment using master contracts from the Department of Enterprise Services (DES).
  • Commissioning and decommissioning vehicles: Fleet staff install specialized equipment before a vehicle can be used for police duties. This equipment is later removed by Fleet staff in accordance with a state law requiring all emergency lighting and other law enforcement equipment to be removed before the vehicle is sold to the public. WSP contracts with DES to sell its decommissioned vehicles.

Fleet also operates maintenance shops in Bellevue, Tumwater, and Shelton that perform diagnostics and routine preventive maintenance. Most vehicle maintenance work is performed by private businesses.

Transition to the Ford Interceptor "EcoBoost" SUV
In response to a series of carbon monoxide leaks in the Ford Interceptor, WSP announced in 2018 it would transition its primary pursuit vehicle to the Ford Police Interceptor Utility EcoBoostThe EcoBoost engine is a standard combustion engine. , which does not appear to have the same issues.

Switching to the EcoBoost increased average biennial acquisition costs by 11%. WSP requested $2 million for increased vehicle costs during the 2019-21 biennium.

WSP planned to spend $13.3 million to purchase and equip 240 pursuit vehicles in the 2019-21 biennium

WSP pays for its pursuit vehicles from the State Patrol Highway Account. The funds cover capital (e.g., vehicle purchases) and operating expenditures (e.g., fuel, maintenance).

  • In the 2017-19 biennium, WSP spent $12.2 million to purchase and equip 285 new pursuit vehicles. The actual expenditures were higher, but were offset by a $900,000 reimbursement from sales of older vehicles.
  • In the 2019-21 biennium, WSP planned to spend $13.3 million to purchase and equip 240 new pursuit vehicles. As noted in the sidebar, the transition to the EcoBoost model is one factor in the cost increase.
  • WSP spent $13.3 million on vehicle maintenance and operating costs in the 2017-19 biennium, and planned to spend $14.4 million in the 2019-21 biennium.
Exhibit 1.1: Pursuit vehicle funding is split between capital and operating expenditures
Graphic showing vehicle purchases and equipment funding vs. vehicle maintenance and operations funding.
Source: Washington State Patrol, AFRS.
Note: Expenditures for vehicle purchases in the 2019-21 biennium will likely be offset by revenue from sales of older vehicles. Sales revenue totaled $900,000 in the 2017-19 biennium. Figures may not add to totals due to rounding.

The portion of WSP's vehicle budget spent on capital versus operating expenditures depends, in part, on the vehicle replacement cycle. Longer replacement cycles will decrease capital costs, as the agency replaces vehicles less frequently. Increased maintenance costs due to higher mileage vehicles will partially offset the reduction in capital expenditures. Exhibit 1.2 shows the breakdown of capital and operating cost components for the 2017-19 biennium.

Exhibit 1.2: For 2017-19, WSP spent the largest portion of its pursuit vehicle budget on purchasing new vehicles and fuel
Graphic showing breakdown of capital costs (80% vehicles and 20% equipment) total of $12.2M vs. operating costs (55% gas, 37% maintenance, and 8% parts) total of $13.3M
Source: Washington State Patrol, AFRS.

In 2019, WSP replaced its pursuit vehicles when they averaged 118,000 miles

Based on surplus vehicle sales data from the Department of Enterprise Services (DES), WSP replaced its Interceptor pursuit vehicles at an average mileage of 118,000 in 2018 and 2019. This equates to about five years of active pursuit duty and is an increase from 2017 when the average mileage for replacing vehicles was 115,000.

20-05 Final Report: Washington State Patrol Pursuit Vehicle Replacement

September 2020

Report Details

2. WSP is not following best practices for life cycle cost analysis

WSP uses a life cycle cost model to estimate costs, but it is not following best practices to identify and communicate the optimal vehicle replacement target

Washington State Patrol (WSP) uses a life cycle cost model to set the pursuit vehicle replacement target

A life cycle cost model is an analytical tool used to quantify the capital and operating costs of an asset over its useful life. For vehicle ownership, a model can convert total costs over time to costs per mile. The optimal replacement target is where total life cycle costs per mile are lowest. Exhibit 2.1 shows the relationship between capital and operating costs over time.

Exhibit 2.1: Capital costs decrease over time as the purchase price is spread out over additional years

Graphic showing optimal replacement target, operating costs per mile, and capital costs per mile

Source: JLARC staff analysis.

Original 1999 model indicated 110,000 miles was optimal time to replace vehicles

WSP began using a life cycle cost model in 1999. The original model was developed during a 1999 JLARC audit to estimate the total cost of vehicle ownership at different mileage intervals. The model indicated that life cycle costs were lowest at 110,000 miles. This is known as the optimal replacement mileage or optimal replacement target. However, the analysis could not extend beyond 110,000 miles because there was insufficient data on higher mileage vehicles at the time.

WSP now uses a National Association of Fleet Administrators (NAFA) model that has resulted in the same replacement target

The 2003 Legislature reduced WSP's pursuit vehicle funding by $2.3 million and directed the agency and JLARC to update the vehicle life cycle cost model. The goal of the update was to identify the costs of keeping vehicles beyond the 110,000 mile replacement target.

WSP purchased a new model from NAFA that estimates life cycle costs up to 150,000 miles. In 2004, WSP reported that the optimal replacement target remained at 110,000 miles (see report to the Legislature, July 2004). WSP's analysis indicated that keeping vehicles until they reached 120,000 miles would increase biennial repair costs by over $200,000.

WSP continues to use the NAFA model to determine the optimal replacement mileage for the Ford Inceptor, its primary pursuit vehicle. WSP also sets replacement targets for its other vehicles, but does not use life cycle cost analysis to determine those targets.

WSP updates its pursuit vehicle life cycle cost model every biennium

WSP updates the data in its pursuit vehicle life cycle cost model every two years in advance of its biennial budget request. The results help to inform WSP's funding request for vehicle expenditures in the upcoming biennium.

To update the model, WSP's Fleet staff review existing data and add new information on vehicles, such as:

  • Acquisition costs for new vehicles.
  • Miles-per-gallon driven.
  • Resale values.
  • Costs and timing of 16 types of vehicle services and repairs.

Some of these data points are calculated based on WSP's fleet and maintenance data, while others are based on assumptions about vehicle performance and professional experience.

WSP includes a narrative summary of its vehicle life cycle cost analysis with its biennial budget request, as required. The summary outlines some of the changes to the model since the last budget request and the results of the analysis, including the optimal replacement target. WSP did not include a copy of the actual model in its most recent 2019-21 budget request. This was the first time agencies submitted their budget requests electronically.

WSP is not following best practices for using and communicating life cycle cost analysis. This limits the accuracy of the analysis and its impact on policy and funding decisions.

JLARC staff reviewed WSP's original NAFA life cycle cost model and the last six iterations of the model, starting with the 2009-11 biennium. WSP has added and removed some data fields, but the overall structure of the model has remained consistent over time. While WSP modeled three different pursuit vehicles Ford Crown Victoria, Chevrolet Caprice, Ford Police Interceptor Utility during this period, the reported optimal replacement target remained at 110,000 miles for each biennium except 2013-15, when it was 120,000 miles. The 110,00 mile replacement target equates to about four-and-a-half years of active pursuit duty.

JLARC staff found that WSP is not following best practices for updating, documenting, and communicating its life cost analysis. This limits the accuracy of its results, and its potential impact on policy and funding decisions. Best practices are based on U.S. General Accounting Office standards and academic literature.

Exhibit 2.2: WSP practices do not reflect best practices for life cycle cost analysis
Best Practice WSP Practice Impact of Not Following Best Practice
Maintain complete and accurate records of maintenance and repair costs per vehicle.

WSP provides limited oversight of the maintenance data entered by its staff, leading to significant outliers and incomplete records.

  • WSP's service and repair data includes just 5 of the 16 categories in the 2019-21 model.
  • 34% of data entries are listed as “other” rather than specific services.

JLARC staff were unable to verify and calculate accurate vehicle maintenance and repair costs. More complete and accurate maintenance records may improve fleet management and produce a more reliable life cycle cost model.

Adhere to standard modeling guidelines, including consistent formulas, discounted cash flows, and established policy constraints.

The 2019-21 life cycle cost model included:

  • Inconsistent formulas and hard-coded values.
  • A policy constraint limiting the maximum replacement mileage to 110,000.
  • Unadjusted future costs and cash flows.
The optimal replacement target was not determined from standard formulas and policy constraints. The analysis may have resulted in higher or lower fleet costs than warranted.
Document assumptions and methods for calculating vehicle costs and for updating the model. WSP reported using a variety of methods to estimate cost inputs. The assumptions and calculations are not documented in the model nor are they maintained by WSP staff.

JLARC staff were unable to verify the cost inputs in the 2019-21 life cycle cost model.

WSP cannot accurately track how costs and other inputs have changed over time.

Simply and clearly communicate the results of life cycle cost analysis with enough detail to easily defend the estimates. Show evidence that the analysis is accurate, complete, and capable of being replicated. The narrative summary submitted in its budget request to the Legislature lacked detail and did not include a copy of the 2019-21 life cycle model.

Legislative staff cannot review and verify the analysis and the underlying assumptions that result in a 110,000 mile replacement target.

Source: JLARC staff analysis.

20-05 Final Report: Washington State Patrol Pursuit Vehicle Replacement

September 2020

Report Details

3. Replacement decisions should consider life cycle costs and other factors

JLARC staff's analysis indicates an optimal replacement target of 130,000 miles, with adjustments for other important factors

After updating the model and factoring in other considerations, JLARC staff identified an optimal replacement target of 130,000 miles

JLARC staff reviewed the 2019-21 pursuit vehicle life cycle cost model to verify whether the 110,000 mile replacement target is accurate. JLARC staff modified the structure and content of the model to align with available fleet data and incorporate best practices for life cycle costing. This included changes to the way certain values are calculated. Highlights of these updates include:

  • Replacing the 16 service and repair categories that are identified in the model with aggregate maintenance costs per vehicle.
  • Estimating high-mileage maintenance costs based on statistical modeling rather than professional judgement.
  • Adding trooper downtime The amount of time troopers spend on tasks related to bringing their vehicles in for maintenance (e.g., transferring equipment between vehicles). to quantify the effect of extended vehicle downtime on agency operations.
  • Calculating vehicle resale values at an annual rate of depreciation based on data provided by the Department of Enterprise Services.
  • Discounting all future life cycle costs to present value The current value of a future cash flow given a specified interest rate. .

Additional details on the data and methodology for these updates are available in Appendix A. The new life cycle cost model is provided in Appendix B.

Costs for replacing vehicles at 130,000 miles and 175,000 miles are statistically equivalent

Life cycle costing, particularly with limited data, involves a certain degree of uncertainty. JLARC staff captured and quantified this uncertainty with a statistical margin of error—calculated at plus-or-minus 1%—and identified a replacement range of statistically equivalent costs.

The updated model calculates a replacement range from 130,000 miles to 230,000 miles. Discussions with law enforcement fleet managers and industry experts highlighted the risks and costs associated with operating high-mileage pursuit vehicles. Based on these conversations, and internal analysis that found increasing costs after 175,000 miles, JLARC staff excluded the upper end of the range. This adjustment left an optimal replacement range from 130,000 miles to 175,000 miles. Within this range, the costs per mile vary to a small degree, but they are within a 1% margin of error.

Exhibit 3.1: Lowest costs per mile are statistically equivalent between 130,000 and 175,000 miles
Graphic showing life cycle cost per mile vs. replacment mileage highlighting that 130K is the lowest mileage within 1% margin of error and 175K as the mileage with the lowest life cycle cost per mile
Source: JLARC staff analysis of WSP fleet data.

Annual fleet costs are also statistically equivalent between 130,000 and 175,000 miles

JLARC staff calculated the impact of different replacement targets on annual capital and operating costs for WSP's current fleet of 700 Ford Interceptors assigned to pursuit duty. If vehicles are replaced at 130,000 miles, annual fleet costs are $12.1 million. If they are replaced at 175,000 miles, annual costs are $11.9 million. While there is a difference in costs, the annual costs are both within a 1% margin of error. Replacing vehicles outside of the optimal range will increase costs, though only modestly. For example, changing the replacement target to 110,000 miles from 130,000 miles increases costs by about 3% or $400,000 per year.

Exhibit 3.2: Changes to replacement targets have modest impact on annual fleet costs
Replacement Mileage Annual Fleet Costs
110,000 $12.5 million
120,000 $12.3 million
130,000 $12.1 million
175,000 $11.9 million
Source: JLARC staff analysis.

Vehicle replacements between 130,000 miles and 175,000 miles are considered cost equivalent. Because factors outside of the model (see below) favor a shorter replacement cycle, JLARC staff conclude that the optimal replacement target is currently 130,000 miles, the lowest mileage within the optimal range.

Additional costs and other non-cost factors should be considered when making vehicle replacement decisions

Life cycle costing is a key tool for efficient fleet management. However, life cycle cost models do not capture all relevant costs and other factors related to owning and operating a vehicle fleet. These factors are difficult to quantify yet important to consider. The cost or risk associated with each factor increases with vehicle mileage.

Some costs are not captured in life cycle cost analysis:

  • Additional pool vehicles. JLARC staff found that non-routine maintenance needs increase with vehicle mileage. When vehicles are out of service for maintenance, there is more demand for pursuit capable pool vehiclesBackup pursuit vehicles that officers use when their normal vehicle is unavailable.. WSP will likely need to expand its pool of backup pursuit vehicles with a higher mileage replacement target, or face a reduction in service. With fewer vehicles available, the agency may not be able to respond as quickly to natural disasters, civil disturbances, and highway blockages.

    Compared to current practice, JLARC staff found that one additional pursuit pool vehicles would be needed to maintain operations at the 130,000-mile replacement level, and four more pool vehicles would be needed at the 175,000-mile replacement level (see Exhibit 3.3).

  • Additional staff due to trooper downtime. JLARC staff's update to the model includes a data field for trooper downtime based on the amount of time troopers spend on non-routine duties when their vehicles require maintenance. This includes hours spent dropping off vehicles, picking up pool vehicles, and transferring equipment between vehicles. WSP may need to hire additional troopers if the amount of time spent on non-routine duties related to vehicle maintenance risks a reduction in service.
  • Unexpected maintenance needs. WSP has limited experience with maintenance costs beyond the 110,000 mile replacement target. The updated model uses statistical methods to estimate high-mileage costs, but there is increasing uncertainty at each subsequent mileage interval. This uncertainty could lead to unexpectedly high costs and should be considered along with other factors when setting the replacement target.
Exhibit 3.3: WSP would need additional pool vehicles at higher replacement mileages to cover increased maintenance needs
Line graph showing at 130K miles one additional pool vehicle would be needed and at 175K miles, four additional pool vehicles would be needed.
Source: JLARC staff analysis of WSP fleet data.

Non-cost factors also influence the optimal replacement mileage for vehicles

Fleet experts, WSP staff, and academic literature identify other important factors to consider when making decisions on replacing vehicles. These include:

  • Safety and emissions: Older pursuit vehicles often lack new safety features and technologies found in current vehicle models. Some of these technologies help to make cars more efficient, reducing the agency's greenhouse gas emissions. The longer a vehicle is held, the more likely it is to lack these features.
  • Reliability: WSP does not typically operate pursuit vehicles beyond 120,000 miles. For an agency tasked with highway safety, uncertain reliability at high mileages could hamper its ability to respond to emergencies.
  • Part availability: Reliable and affordable spare parts may be harder to find for older models.
  • Agency image: WSP's public image includes standardized pursuit vehicles. A lower mileage replacement target can help to keep the fleet uniform and modern.

These non-cost factors favor a lower mileage replacement target and should be considered along with the results of the life cycle cost analysis and the other costs when making vehicle replacement decisions.

20-05 Final Report: Washington State Patrol Pursuit Vehicle Replacement

September 2020

Report Details

4. Data quality and assumptions influence optimal replacement target

The optimal replacement target for vehicles can vary significantly depending on the costs and assumptions used in the analysis

JLARC staff applied sensitivity tests on the updated life cycle cost model to identify:

  • Which costs have the largest effect on the optimal replacement target.
  • Where the agency needs to improve its data quality.
  • How future changes to vehicle acquisition costs and interest rates may affect the optimal replacement target.

Uncertain costs and assumptions can significantly impact the optimal replacement target

The optimal replacement target is sensitive to a number of inputs in the model:

  • Generally, higher upfront costs (e.g., vehicle purchase costs) lead to higher optimal replacement mileages because it takes longer to spread out the costs of the initial capital investment. For example, a 1% increase in purchase costs (about $460) will increase the optimal replacement target by 1,500 miles.
  • However, increased maintenance and operating costs can result in lower optimal replacement mileages. For example, a 1% increase in maintenance costs lowers the optimal replacement target by 900 miles.

WSP's transition to the EcoBoost model pursuit vehicle is expected to increase purchase costs in 2019-21 by 11%. The future maintenance and operating costs of this model are largely uncertain at this time. More reliable data on costs related to maintenance, trooper downtime, and resale value for the EcoBoost could significantly effect the optimal replacement target in the future.

Discount rates will also affect optimal replacement target

Discount rates also have a large effect on life cycle costs. The 5-year real discount rateThe inflation-adjusted interest rate used to calculate the present value of future cash flows. is currently -0.3%, per the Federal Office of Management and Budget. Exhibit 4.1 lists the optimal replacement target at various hypothetical 5-year real discount rates. These rates show a range of effects on the optimal replacement target. JLARC staff are unable to determine the likelihood of any specific future discount rate.

Exhibit 4.1: Future discount rates will affect optimal replacement target
Hypothetical 5-Year Real Discount Rate Optimal Replacement Target (miles)
-1.0% 125,000
-0.3% 130,000
0.0% 135,000
0.5% 140,000
1.0% 145,000
Source: JLARC staff analysis.

The analysis above shows that the optimal replacement target is sensitive to a number of inputs used in the model. While rising costs to purchase and equip vehicles may increase the optimal replacement mileage, there is significant uncertainty surrounding many of the other future costs, including how the new EcoBoost model will perform relative to the previous model of pursuit vehicle.

20-05 Final Report: Washington State Patrol Pursuit Vehicle Replacement

September 2020

Report Details

Appendix A: Detailed statistical analysis

JLARC staff used advanced statistical analysis to address data limitations

JLARC staff used several statistical and analytical methods to update the life cycle cost model and calculate the optimal replacement range and target. This appendix documents the methodologies we used to:

  • Aggregate maintenance costs for a subset of vehicles with reliable maintenance records.
  • Project maintenance costs beyond observable data.
  • Calculate vehicle depreciation rates from surplus vehicle sales data.
  • Estimate the frequency of high-cost repairs beyond observable data.

JLARC staff developed criteria to identify and exclude vehicles with questionable maintenance records

JLARC staff identified two issues with WSP's vehicle maintenance data that impacts the life cycle cost model:

  • The data contains a high number of outliers and inconsistencies.
  • The data lacks the detail needed to calculate repair costs and frequencies for the 16 service and repair categories used by WSP.

Removing unreliable maintenance records from the analysis

JLARC staff created a series of data filters to identify and exclude vehicles with questionable maintenance records. These filters were applied to all Ford Interceptors in the maintenance database. The filters removed the following:

  • Individual records with repair costs or vehicle mileages outside of a specified parameter. JLARC staff excluded maintenance records where the reported vehicle mileage was either negative or greater than 30,000 per year and records with either negative or null repair costs.
  • Vehicles with less than four maintenance records per year. WSP pursuit vehicles are driven about 25,000 miles per year and WSP policy requires preventive maintenance every 5,000 miles. Therefore, pursuit vehicles should have a minimum of 4-5 maintenance records per year. This filter removes both vehicles with potentially incomplete maintenance records and those assigned to non-pursuit duty, which are typically driven fewer miles per year.
  • Vehicles that have no maintenance records for more than 10,000 miles. A vehicle with a 10,000-mile maintenance gap indicates that either the record is incomplete or the vehicle is not being properly maintained or regularly used.

JLARC staff identified 325 vehicles and 7,804 records meeting the above criteria and removed them from the analysis. The remaining data subset includes 35% of Ford Interceptors (325) and 47% of the original records.

JLARC staff aggregated maintenance costs for a subset of vehicles

JLARC staff combined WSP's 16 service and repair categories into a single, cumulative maintenance cost equal to the sum of all repairs through a specific mileage interval. Bypassing the 16 repair categories allowed JLARC staff to account for the lack of detail available in WSP's maintenance data.

Exhibit A1: Example of cumulative maintenance cost calculation
Repair # Repair Cost Cumulative Cost
1 $300 $300
2 $150 $450
3 $500 $950
Source: JLARC staff analysis.

JLARC staff used statistical modeling to project maintenance costs, depreciation rates, and repair frequencies

Projecting maintenance costs beyond observable data

Calculating life cycle costs becomes increasingly difficult as vehicle mileage increases and the maintenance costs and data become obscured by the 110,000-mile replacement cycle. The data itself does not become less accurate, but rather it no longer reflects the true cost of ownership.

Example 1: Vehicle A (50,000 miles) and Vehicle B (100,000 miles) need identical repairs costing $2,000 each. WSP decides to only pay for half the repairs on Vehicle B because it is scheduled to be replaced within the next year. WSP's maintenance data will show decreasing costs as the vehicle nears its 110,000-mile replacement cycle even though the vehicle required more expensive repairs. WSP's repair decisions and its selection of a vehicle replacement target will impact the overall distribution of maintenance costs in its database.

Example 2: The frequency of repairs is also affected by the replacement cycle. While fewer cars are driven to 100,000 miles than 50,000 miles (e.g., due to collisions), the frequency of repairs at higher mileages drops well below what can be attributed to the distribution of vehicles at each mileage interval. For example, if Vehicle B in the scenario above cannot return to service for less than $2,000, WSP may opt to replace the vehicle at 100,000 miles instead of spending $2,000 on repairs. Preventive maintenance also occurs less frequently at higher mileage. The effect of both examples is to reduce the number of repairs for high-mileage vehicles.

Exhibit A2: 4% of maintenance records were for vehicles with more than 100,000 miles
Number%20of%20Repairs-01.svg
Source: JLARC staff analysis of WSP fleet data.

JLARC staff used statistical modeling to account for these data limitations and project maintenance costs beyond observable and reliable data. To estimate the relationship between cumulative maintenance costs and vehicle mileage, JLARC staff fit a linear model to the observed data points. This model was used to predict unobserved cumulative maintenance costs across a range of replacement mileages.

Exhibit A3 compares maintenance cost estimates from the updated life cycle cost model and the 2019-21 WSP model. WSP's model finds lower cumulative maintenance costs at two intervals: 100,000 miles and 110,000 miles.

Exhibit A3: Comparing cumulative maintenance costs in WSP's model and JLARC staff's updated model
Mileage Interval WSP 2019-21 Model JLARC Staff Model
50,000 $3,385 $2,360
90,000 $8,034 $7,646
100,000 $8,863 $9,440
110,000 $10,889 $11,422
120,000 $16,776 $13,593
130,000 $20,189 $15,953
140,000 $21,609 $18,502
140,000 $25,720 $21,240
Source: JLARC staff analysis and WSP.

Calculating vehicle depreciation

JLARC staff used vehicle surplus sales data from the Department of Enterprise Services (DES) to calculate the depreciation rateVehicle resale value divided by purchase price. for the Ford Interceptor. The data covers all WSP vehicles sent to surplus from 2014-19. JLARC staff filtered the data to remove total loss vehicles or vehicles that had either no mileage or sale price listed. The remaining dataset included 75 Ford Interceptors.

JLARC staff fit a linear model to the data to measure the quantitative relationship between the vehicle depreciation and years in service.

The analysis showed that WSP's Ford Interceptors retain, on average, 71.74% of their original value every year of operation. This model was used to project vehicle depreciation beyond 4.5 years. For example, the projected resale value of a $40,000 vehicle after one year of service is equal to $28,696 ($40,000 x 0.7174). After two years in service, the same vehicle has a projected resale value of $20,587 ($28,696 x 0.7174).

Estimating frequency of high cost repairs

JLARC staff used Bayesian statistics to estimate the likelihood that a WSP Ford Interceptor experiences a high cost repair at a given mileage interval. High cost repairs were defined as any non-collision repair costing over $500. The high cost variable was created to exclude preventive maintenance records from the analysis. Preventive maintenance occurs on a set schedule that is unaffected by the vehicle's age and condition. The high cost variable was also designed to capture the types of repairs that require the trooper to leave the vehicle at the maintenance shop for at least one shift (8 hours).

JLARC staff fit probability distributions to data on the frequency of high cost repairs. The parameters of these probability distributions were then extrapolated to unobserved mileage intervals. The maximum likelihood estimate of each mileage interval was then used to determine the average expected number of high cost repairs at observed mileages and unobserved mileages.

Using probabilistic risk analysisA method for quantifying the reliability of complex systems pioneered by NASA. , JLARC staff calculated failure rates based on the frequency of high cost repairs. The failure rates were used to estimate the expected number of vehicles down at any given point in time across a range of mileage intervals. The analysis found that the likelihood that vehicles need high cost repairs increases at higher mileages. JLARC staff used this information to calculate the number of pool vehicles WSP would need to ensure sufficient availability when vehicles are being repaired. The results of this analysis are presented in Exhibit A4 for three risk thresholds, representing the number of pool vehicles needed to ensure sufficient availability 90%, 95%, and 99% of the time. This analysis is intended to illustrate a hypothetical example of one of the hidden costs of increasing the vehicle replacement target. It does not account for the distribution of pool vehicles throughout the state or other factors that affect pool vehicle demand and availability.

Exhibit A4: Optimizing the pursuit vehicle pool size
Number of pursuit vehicles needed to ensure vehicle availability
Mileage Interval 90% of the time 95% of the time 99% of the time
0-25,000 20 21 24
25,000-50,000 22 23 26
50,000-75,000 24 26 29
75,000-100,000 26 28 31
100,000-125,000 27 28 32
125,000-150,000 28 29 33
150,000-175,000 29 31 35
175,000-200,000 31 33 36
Source: JLARC staff analysis of WSP fleet data.

20-05 Final Report: Washington State Patrol Pursuit Vehicle Replacement

September 2020

Report Details

Appendix B: JLARC life cycle cost model

JLARC staff updated the pursuit vehicle life cycle cost model

The life cycle cost model created and used by JLARC staff for the analysis in this report is linked below. The model includes all of the variables and inputs used to calculate the 2019-21 optimal replacement range of 130,000 miles to 175,000 miles and an optimal replacement target of 130,000 miles. Additional information on the analysis is available by request.


AppendixImage.svg

JLARC staff contracted with consultants Robert Thomas and Robert Williams to update the Washington State Patrol’s pursuit vehicle life cycle cost model. Their work played an instrumental role in analyzing the original WSP model and in aligning the new life cycle cost model with industry best practices.


20-05 Final Report: Washington State Patrol Pursuit Vehicle Replacement

September 2020

Report Details

Appendix C: Applicable statutes

RCW 46.37.195, ESHB 1160.SL

Sale of emergency vehicle lighting equipment restricted—Removal of emergency vehicle equipment, when required—Exception.

RCW 46.37.195

(1) Except as provided in subsection (2) of this section, a public agency, business, entity, or person shall not sell or give emergency vehicle lighting equipment or other equipment to a person who may not lawfully operate the lighting equipment or other equipment on the public streets and highways. Prior to selling or giving an emergency vehicle to a person or entity that is not a public law enforcement or emergency agency within or outside the state, public law enforcement or emergency agency in another country, or private ambulance business within or outside the state, the seller or donor must remove all emergency lighting as defined in rules by the Washington state patrol, radios, and any other emergency equipment from the vehicle, except for reflective stripes and paint on fire trucks, that was not originally installed by the original vehicle manufacturer and that visibly identifies the vehicle as an emergency vehicle from the exterior, including spotlights and confinement or rear seat safety cages. If the equipment is not retained or transferred to another public law enforcement or emergency agency within or outside the state, public law enforcement or emergency agency in another country, or private ambulance business within or outside the state, the equipment must be dismantled with the individual parts being recycled or destroyed prior to being disposed of. The agency must also remove all decals, state and local designated law enforcement colors, and stripes that were not installed by the original vehicle manufacturer.

(2) The sale or donation to a broker specializing in the resale of emergency vehicles, or a charitable organization, intending to deliver the vehicle or equipment to a public law enforcement or emergency agency within or outside the state, public law enforcement or emergency agency in another country, or private ambulance business within or outside the state, is allowed with the emergency equipment still installed and intact. If the broker or charitable organization sells or donates the emergency vehicle to a person or entity that is not a public law enforcement or emergency agency, or private ambulance business, the broker or charitable organization must remove the equipment and designations and is accountable and responsible for the removal of the equipment and designations not installed on the vehicle by the original vehicle manufacturer. Equipment not sold or donated to a public law enforcement or emergency agency, or a private ambulance business, must be removed and transferred, destroyed, or recycled in accordance with subsection (1) of this section.

[ 2010 c 117 § 2; 1990 c 94 § 2.]

NOTES:

Intent—2010 c 117: "It is the intent of the legislature to protect the public to ensure that only federal, state, and local law enforcement and emergency personnel, public or private, or other entities authorized by law to use emergency equipment have access to emergency equipment and vehicles." [ 2010 c 117 § 1.]

Legislative finding—1990 c 94: "The legislature declares that public agencies should not engage in activity that leads or abets a person to engage in conduct that is not lawful. The legislature finds that some public agencies sell emergency vehicle lighting equipment at public auctions to persons who may not lawfully use the equipment. The legislature further finds that this practice misleads well-intentioned citizens and also benefits malevolent individuals." [ 1990 c 94 § 1.]

Transportation Budget

Engrossed Substitute House Bill 1160: Chapter 416, Laws of 2019

NEW SECTION. Sec. 107. FOR THE JOINT LEGISLATIVE AUDIT AND 33 REVIEW COMMITTEE 34 State Patrol Highway Account—State Appropriation. . . . . . . $90,000 p. 3 ESHB 1160.SL 1

The appropriation in this section is subject to the following conditions and limitations: $90,000 of the state patrol highway account—state appropriation is provided solely for an update to the 1999 study of the Washington state patrol's vehicle replacement life cycle cost model.

20-05 Final Report: Washington State Patrol Pursuit Vehicle Replacement

September 2020

Recommendations & Responses

Legislative Auditor Recommendation

The Legislative Auditor makes three recommendations to improve fleet management.

WSP can address the limitations with its vehicle replacement program through better data, documentation, and communication.

Recommendation #1: The Washington State Patrol (WSP) should improve the procedures and data systems it uses to collect and track vehicle maintenance data.

WSP should identify the data elements that are most important for effective fleet management and accurate life cycle costing (e.g., cost and frequency of repairs). This process could lead to a reduction in the amount of information the agency collects. Once it identifies the essential elements, WSP should implement procedures for data collection and documentation that ensure accuracy, reliability, and accessibility.

Legislation Required: No
Fiscal Impact: JLARC staff assume the initial review can be done within existing resources. WSP should determine what improvements can be done within existing resources and what could be done with more resources.
Implementation Date: July 2021
Agency Response: The Washington State Patrol and the Office of Financial Management concur with this recommendation.

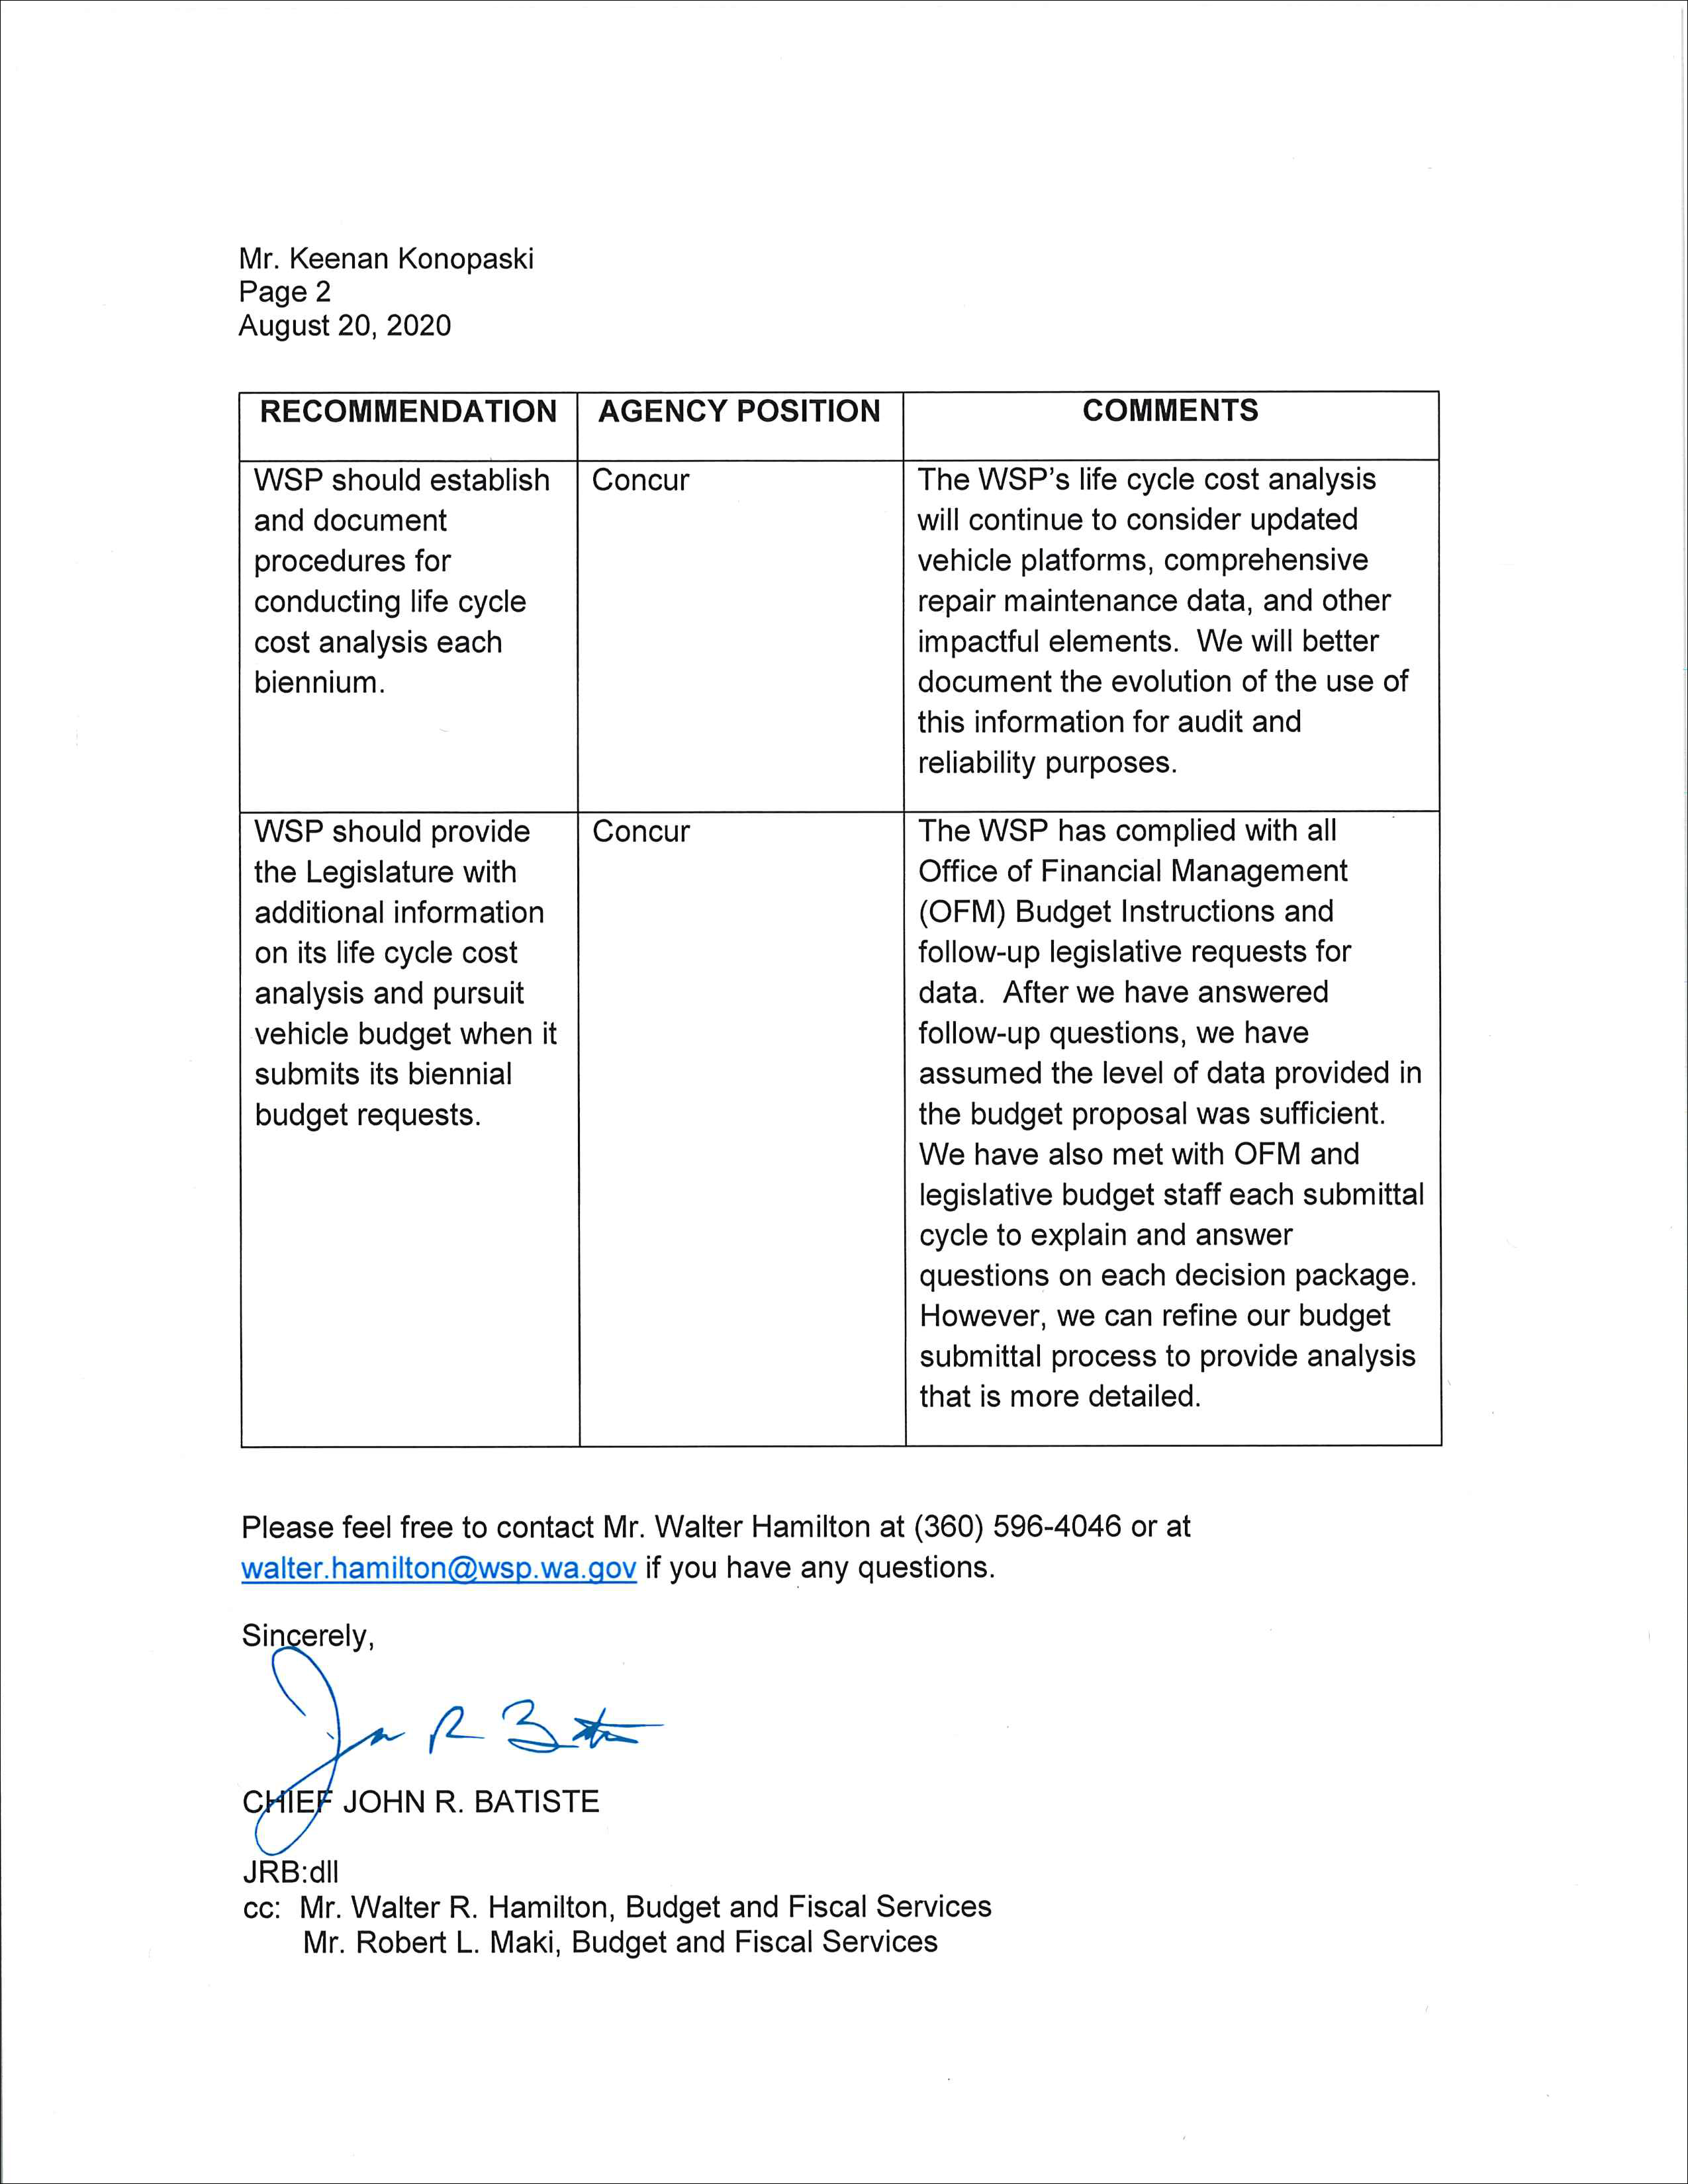
Recommendation #2: WSP should establish and document procedures for conducting life cycle cost analysis each biennium.

WSP should use life cycle cost analysis to inform its biennial budget request for vehicle purchases. WSP’s procedures should be based on best practices for life cycle costing and the modified JLARC life cycle cost model. WSP should document the data sources, assumptions, and methodologies used to calculate fleet costs and complete the analysis.

Legislation Required: No
Fiscal Impact: JLARC staff assume that this recommendation can be completed within existing resources.
Implementation Date: In advance of the 2023-25 budget request.
Agency Response: The Washington State Patrol and the Office of Financial Management concur with this recommendation..

Recommendation #3: WSP should provide the Legislature with additional information on its life cycle cost analysis and pursuit vehicle budget when it submits its biennial budget requests.

To improve communication between WSP and the Legislature, WSP should include the following in its biennial budget requests:

  • A digital copy of the life cycle cost model it uses to determine an optimal replacement target for its vehicles.
  • A narrative summary of the analysis.
  • A clear link between the optimal replacement target and any requests for additional pursuit vehicle funding.
  • Any factors outside of the analysis that affect the replacement cycle (e.g., vehicle safety or vehicle downtime). WSP should provide written justification if these factors move the replacement target outside of the optimal range identified by the model.
Legislation Required: No
Fiscal Impact: JLARC staff assume that this recommendation can be completed within existing resources.
Implementation Date: In advance of the 2021-23 budget request.
Agency Response: The Washington State Patrol and the Office of Financial Management concur with this recommendation.

20-05 Final Report: Washington State Patrol Pursuit Vehicle Replacement

September 2020

Recommendations & Responses

WSP Response

Image of WSP Response - page one


Image of WSP Response - page two


20-05 Final Report: Washington State Patrol Pursuit Vehicle Replacement

September 2020

Recommendations & Responses

OFM Response

ar1_b.png


20-05 Final Report: Washington State Patrol Pursuit Vehicle Replacement

September 2020

Recommendations & Responses

Current Recommendation Status

JLARC staff follow up with agencies on Legislative Auditor recommendations for 4 years. Responses from agencies on the latest status of implementing recommendations for this report will be available in 2022.

20-05 Final Report: Washington State Patrol Pursuit Vehicle Replacement

September 2020

More About This Review

Audit Authority

The Joint Legislative Audit and Review Committee (JLARC) works to make state government operations more efficient and effective. The Committee is comprised of an equal number of House members and Senators, Democrats and Republicans.

JLARC's non-partisan staff auditors, under the direction of the Legislative Auditor, conduct performance audits, program evaluations, sunset reviews, and other analyses assigned by the Legislature and the Committee.

The statutory authority for JLARC, established in Chapter 44.28 RCW, requires the Legislative Auditor to ensure that JLARC studies are conducted in accordance with Generally Accepted Government Auditing Standards, as applicable to the scope of the audit. This study was conducted in accordance with those applicable standards. Those standards require auditors to plan and perform audits to obtain sufficient, appropriate evidence to provide a reasonable basis for findings and conclusions based on the audit objectives. The evidence obtained for this JLARC report provides a reasonable basis for the enclosed findings and conclusions, and any exceptions to the application of audit standards have been explicitly disclosed in the body of this report.

Committee Action to Distribute

On September 30, 2020 this report was approved for distribution by the Joint Legislative Audit and Review Committee. Action to distribute this report does not imply the Committee agrees or disagrees with Legislative Auditor recommendations.

20-05 Final Report: Washington State Patrol Pursuit Vehicle Replacement

September 2020

More About This Review

Study Questions


PSQ.svg


20-05 Final Report: Washington State Patrol Pursuit Vehicle Replacement

September 2020

More About This Review

Methodology

The methodology JLARC staff use when conducting analyses is tailored to the scope of each study, but generally includes the following:

  • Interviews with stakeholders, agency representatives, and other relevant organizations or individuals.
  • Site visits to entities that are under review.
  • Document reviews, including applicable laws and regulations, agency policies and procedures pertaining to study objectives, and published reports, audits or studies on relevant topics.
  • Data analysis, which may include data collected by agencies and/or data compiled by JLARC staff. Data collection sometimes involves surveys or focus groups.
  • Consultation with experts when warranted. JLARC staff consult with technical experts when necessary to plan our work, to obtain specialized analysis from experts in the field, and to verify results.

The methods used in this study were conducted in accordance with Generally Accepted Government Auditing Standards.

More details about specific methods related to individual study objectives are described in the body of the report under the report details tab or in technical appendices.

20-05 Final Report: Washington State Patrol Pursuit Vehicle Replacement

September 2020

Contact

JLARC Authors

Zack Freeman, Research Analyst, 360-786-5179

Josh Karas, Research Analyst, 360-786-5298

Valerie Whitener, Audit Coordinator

Keenan Konopaski, Legislative Auditor

20-05 Final Report: Washington State Patrol Pursuit Vehicle Replacement

September 2020

Contact

JLARC Members

Senators

Bob Hasegawa

Mark Mullet, Chair

Rebecca Saldaña

Shelly Short

Dean Takko

Lynda Wilson, Secretary

Keith Wagoner

Representatives

Jake Fey

Noel Frame

Larry Hoff

Christine Kilduff

Vicki Kraft

Ed Orcutt, Vice Chair

Gerry Pollet, Assistant Secretary

Drew Stokesbary