JLARC Final Report: 2015 Tax Preference Performance Reviews
Report 15-5, January 2016
Overview: Taxation of Washington’s Agricultural Industry
- 2015 Agricultural Preferences
- Who Is a Farmer, and What Do They Grow?
- Farms in Washington - An Overview
- State Taxes and the Agriculture Industry
- Farmers as “Price Takers” or “Price Makers”
- Federal Farm Price Supports
|
Commercially Grown Fish and Shellfish Enhanced Food Fish Tax |
| Family Farm and Business Property Estate Tax |
| Farm Machinery Replacement Parts Sales and Use Tax |
| Fuel Used on Farms Sales and Use Tax |
| Fuel Used to Heat Chicken Houses; Chicken Bedding Materials Sales and Use Tax |
| Grain and Unprocessed Milk Wholesaling B & O Tax |
| Horticultural Services for Farmers Sales and Use Tax |
| Livestock Medicine Sales and Use Tax |
State tax law (RCW 82.04.213(2)) defines a “farmer” as a person who grows, raises, or produces any “agricultural product” that will be sold. Farmers grow these products on land to which they have a current right of possession, such as land they own or lease.
A farmer does not include people who:
- Grow or produce products for their own consumption;
- Operate stockyards, slaughter, or packing houses; or
- Take, grow, or raise timber.
An “agricultural product” (RCW 82.04.213(1)) is any product of plant cultivation or animal husbandry including:
- Horticulture;
- Grain;
- Vermiculture (growing worms);
- Viticulture (growing grapes);
- Aquaculture (growing fish);
- Christmas trees;
- Short-rotation hardwoods;
- Turf;
- Private sector cultured aquatic products, such as scallops, manila or butter clams, oysters, salmon, catfish;
- Birds:
- Insects;
- Any substances obtained from any animals or products noted above.
Approximately 300 crops are produced each year in Washington on 37,000 farms. Apples, wheat, milk, potatoes, and hay were the top commodities in 2012. Agricultural products do not include marijuana, usable marijuana, or marijuana-infused products or animals that are pets.
The following series of charts features data collected by the United States Department of Agriculture (USDA) via its Census of Agriculture (which is conducted every five years for all U.S. farms) or through surveys, which are conducted annually from samples of farms. The USDA defines “farm” in its census data as “any place from which $1,000 of agricultural products were produced and sold or normally would have been sold, during the Census year.” The data shown goes back as far as possible, based on what the USDA collected and makes available.
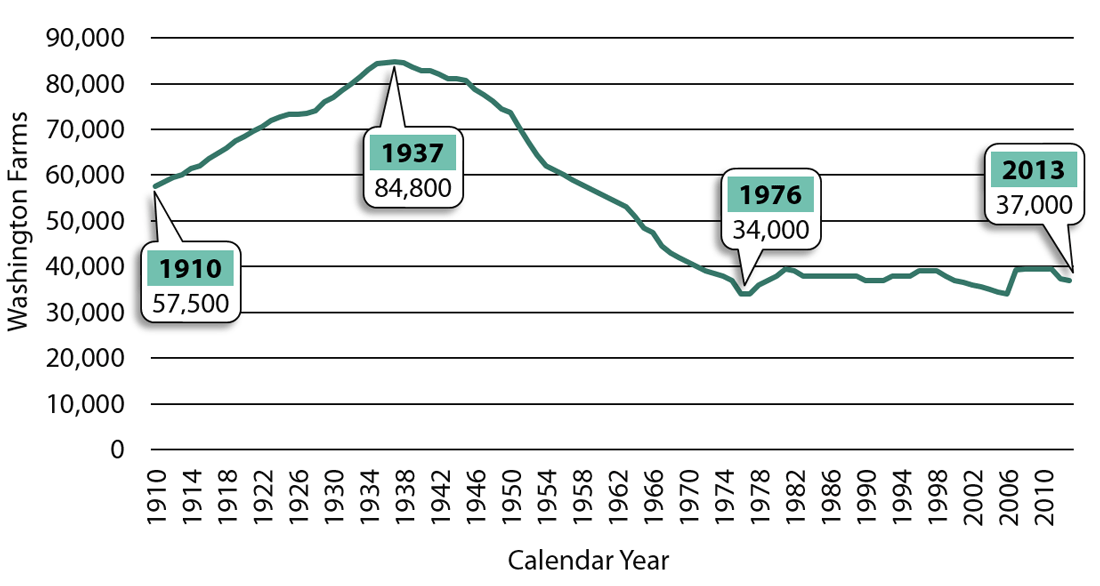
Number of Farms
USDA data shows that farm numbers in Washington peaked at 84,800 farms in 1937, at the height of the Great Depression. The latest data reflects 37,000 farms in 2013. See Exhibit 1, below.
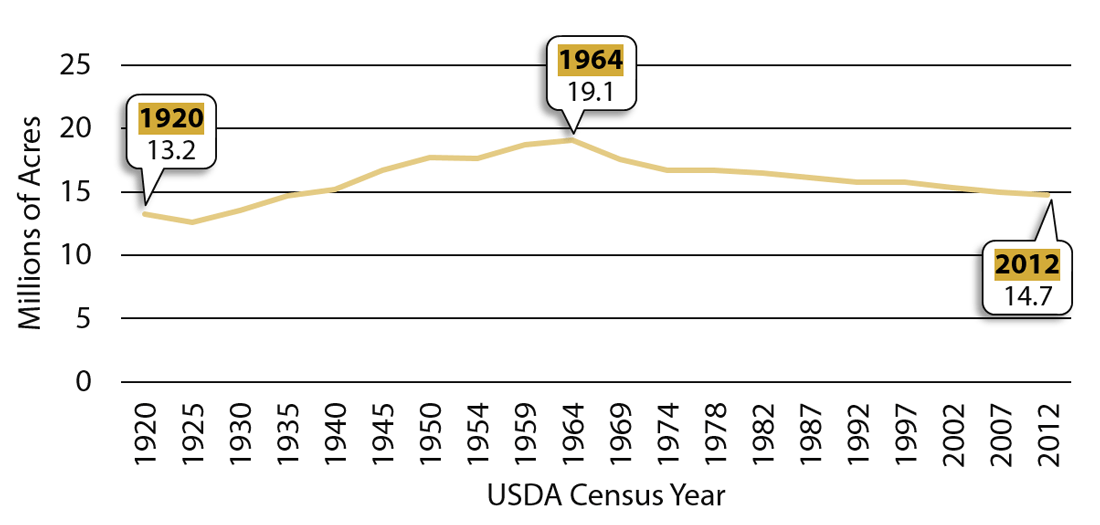
Farm Acreage
Exhibit 2, below, shows farm acreage in Washington from 1920 to 2012. Total farm acreage in Washington increased from 1920 to 1964, and has been decreasing since.
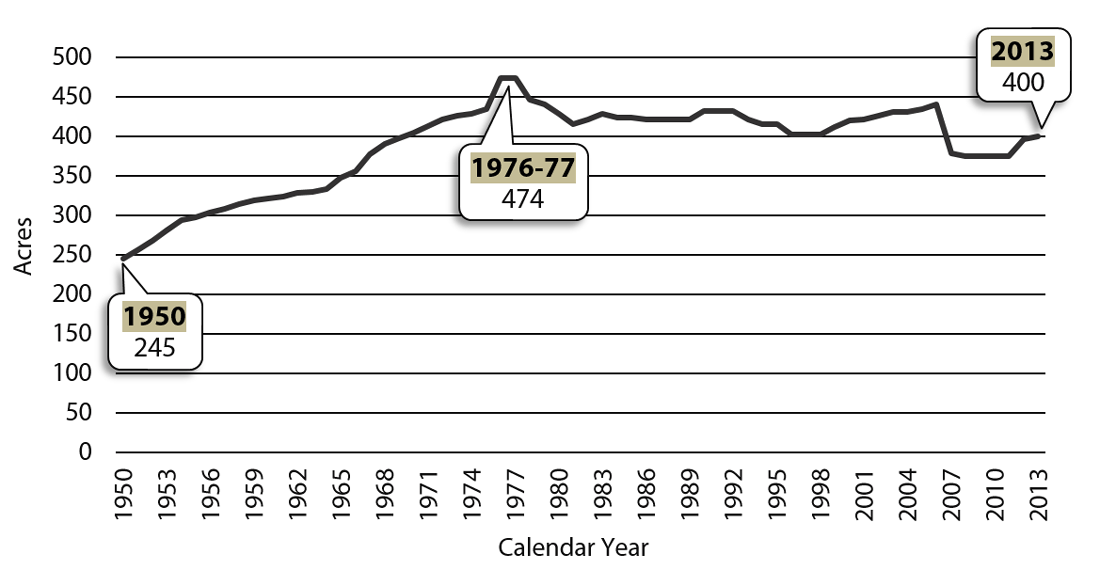
Farm Size
The average farm size in Washington in 1950 was 245 acres. In 2013, the average was 400 acres. See Exhibit 3, below.
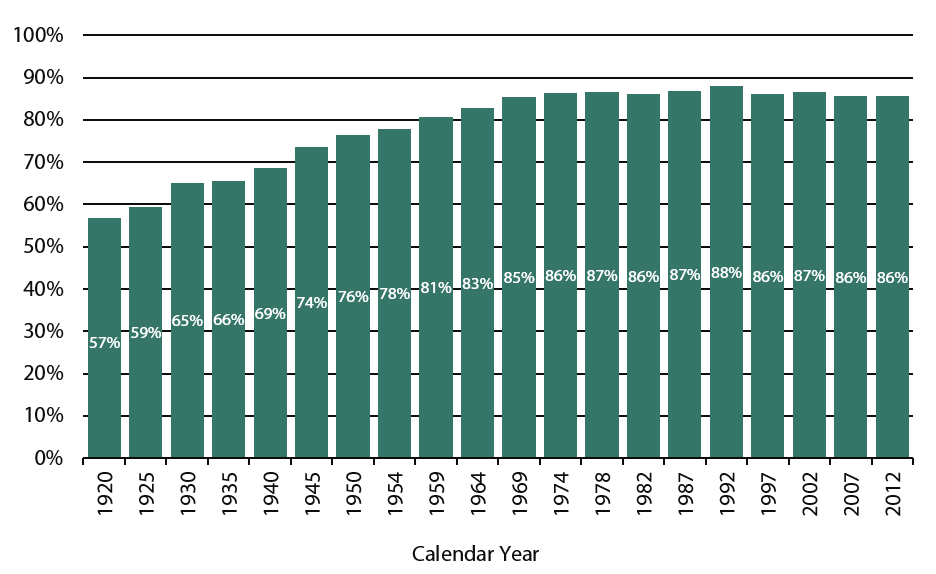
Since 1920, the portion of Washington farm acreage in larger farms has increased. The percentage of total Washington farmland included in farms with 500 or more acres increased steadily from 57 percent in 1920 to 86 percent of farm acres in 1974. Since that time, the percent of Washington’s farm acreage in farms with 500 or more acres remained near 86 percent. See Exhibit 4, below.
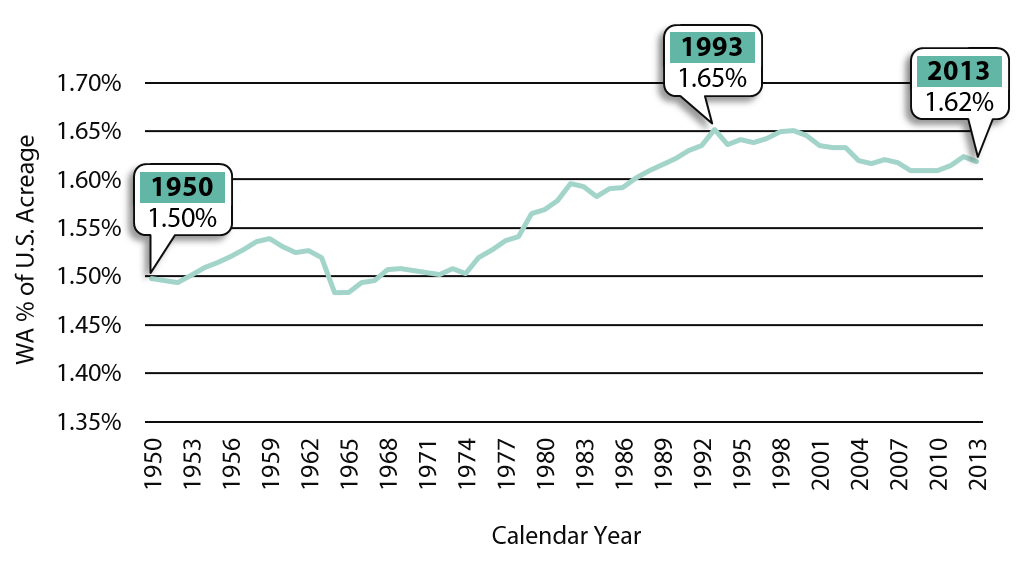
Washington’s Share of U.S. Farm Numbers and Acreage
Since 1910, Washington’s share of the total number of U.S. farms has increased, from 0.8 percent in 1910 to nearly 1.8 percent in 2013.
Washington’s share of U.S. farm acreage has increased since 1950, when the state’s farm acreage was 1.5 percent of total national acreage. Washington’s share peaked at 1.65 percent in 1993 and in 2013 was 1.62 percent. See Exhibit 5, below.
Property Tax and Agriculture- Major Milestones
Before 1932
Property tax was the primary tax imposed by the state.
1932
State voters passed two initiatives in November 1932.
- One limited property taxes and reduced income from state property taxes by about 50 percent beginning in 1934.
- The other imposed a state personal and corporate income tax.
Together, these two initiatives were seen as a form of tax relief for property owners and were strongly supported by the state’s agriculture industry.
1933
While the property tax limitation initiative was adopted, the income tax initiative was struck down by the State Supreme Court early in 1933.
1973
The Legislature enacted the current use property tax program for agriculture, timber, and open space properties. Beginning in 1974, property tax for agricultural land was assessed for property tax purposes on the land’s current use, rather than its “highest and best” use. This reduced the property taxes farmers owed.
To receive the reduced assessment, agricultural land must meet one of the following requirements:
- 20 or more acres in agricultural use; or
- 50 or more total acres, but less than 20 acres in agricultural use with an annual income of $200 or more per acre for three out of five years; or
- Less than five acres in agricultural use with an annual income of $1,500 or more for three out of five years.
According to the Department of Revenue, the average annual property tax value reduction from 1993 through 2014 was 70 percent. In 2014, the current use value reduction was 69 percent for 11.4 million acres of agricultural land. The Legislature specifically exempted the current use valuation tax preference from the Citizen Commission’s tax preference review process per RCW 43.136.045.
B&O Tax and Agriculture - Major Milestones
1933
After the State Supreme Court struck down the income tax initiative, the Legislature adopted a temporary, two-year business activities tax, applying certain rates (based on the business activity) to a business’s value of products, gross proceeds of sales, or gross business income. Although the legislation provided a lower rate for farmers, the Governor vetoed the tax on agricultural producers, indicating that any income collected would not match the nuisance to the producer and administrative costs to collect.
1935
The Legislature enacted the Revenue Act of 1935. The 1935 Act continued the business taxes (the business and occupation or B&O tax) previously imposed in 1933 and added several new taxes. The Legislature provided a B&O tax exemption for income from wholesale sales of agricultural products grown, raised, or produced by a farmer and another exemption for persons processing horticultural products. JLARC staff reviewed these preferences in 2008.
After 1935
Changes in B&O taxation of the agriculture industry after 1935 have typically broadened the definition of “farming” activities and added new exemptions or preferential rates for certain agricultural activities or related services. As of April 2015, JLARC staff identified 25 agriculture-related B&O tax preferences.
Sales and Use Tax and Agriculture - Major Milestones
1935
The Legislature enacted the Revenue Act of 1935. The 1935 Act continued the business taxes previously imposed in 1933 and added several new taxes, including a two percent sales and use tax. The Legislature provided an exemption for feed purchased by farmers. This preference was reviewed by JLARC staff in 2009.
After 1935
The Legislature has enacted several sales and use tax exemptions for the agriculture industry and related activities since the sales and use tax was first enacted, beginning in 1943 with sales and use tax exemptions for seed, fertilizer, and spray materials and for farm auction sales. JLARC staff reviewed these preferences in 2009 and 2008. As of April 2015, JLARC staff identified 29 agriculture-related sales and use tax preferences.
Current Agriculture-Related Tax Preferences
JLARC staff categorized current agriculture-related tax preferences into six general types. Exhibit 6, below, reflects the year that the Legislature initially enacted the tax preference. The six categories are noted in the exhibit legend. Click to view in pdf format.
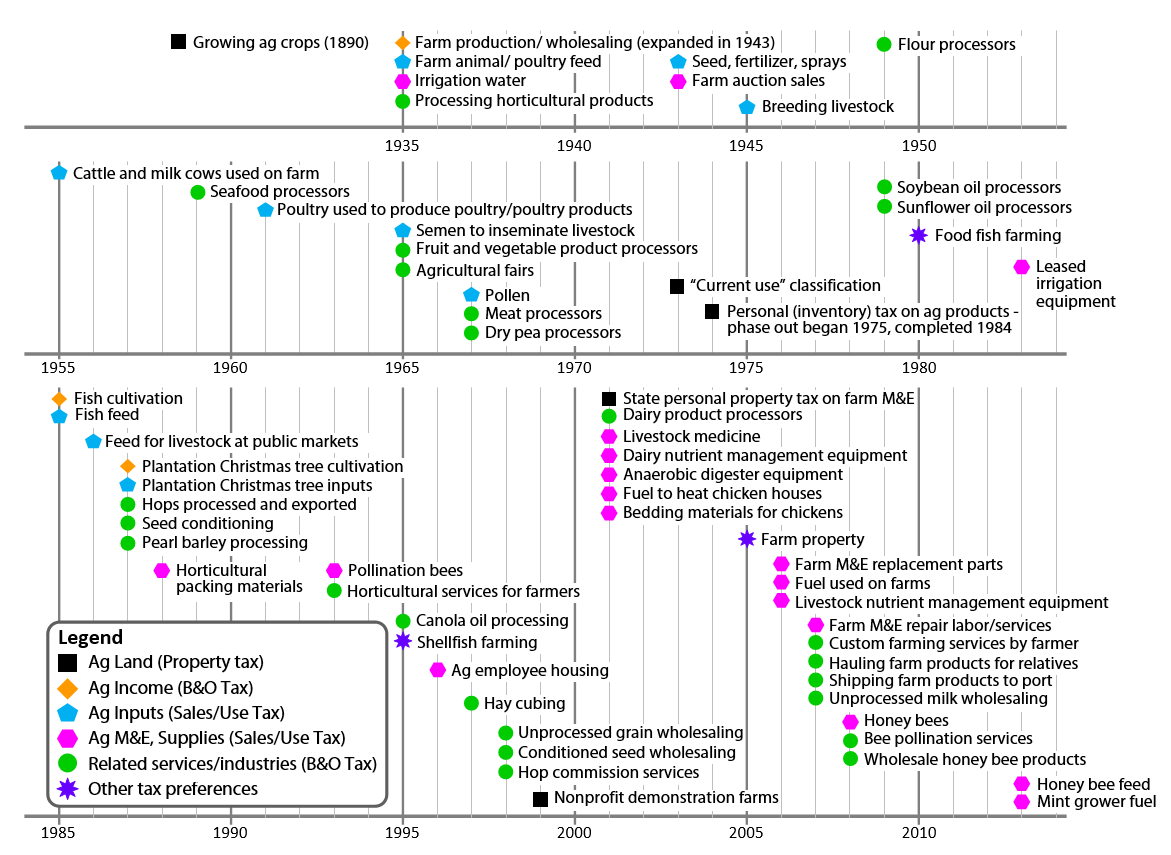
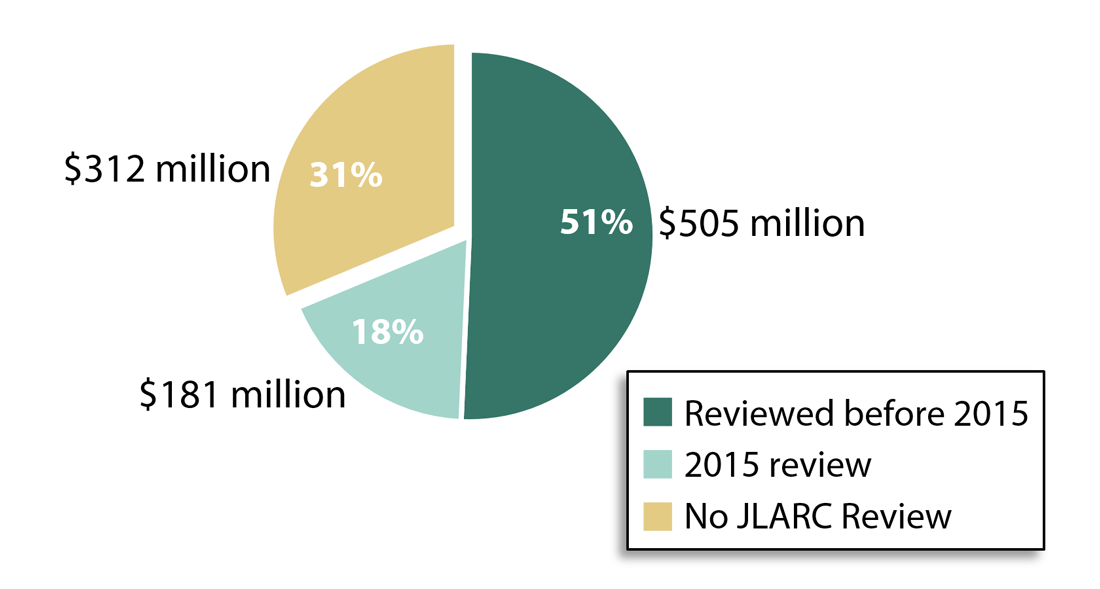
Using the most recent data available, JLARC staff estimate beneficiary savings for these agriculture-related tax preferences at $998.6 million per biennium.
- In 2015, JLARC staff reviewed nine of these preferences totaling $181.4 million in the 2015-17 biennium.
- JLARC staff previously reviewed 22 agriculture-related tax preferences, with an estimated biennial beneficiary savings of $505.3 million.
- Another 32 tax preferences, totaling $311.8 million in estimated biennial beneficiary savings, are either statutorily prohibited from a JLARC review, have not been scheduled for review by JLARC staff, or are too new to yet be scheduled for review. Beneficiary savings estimates come from the most recent Department of Revenue Tax Exemption Report or through fiscal note estimates.
The preferences previously reviewed by JLARC staff are shown in Exhibit 8, below.
| Year Reviewed | Year Enacted | Tax Preference (Type of Tax) |
Legislative Auditor Recommendation |
Estimated Beneficiary Savings |
|---|---|---|---|---|
| 2007 | 1890 | Growing Crops (Property Tax) | Continue | $5,450,000 |
| 2007 | 2004 | Beef Processors (B&O Tax) Expired 12/31/2007 | Allow to Expire | $0 |
| 2008 | 1935 | Agricultural Producers (B&O Tax) | Review and Clarify | $65,800,000 |
| 2008 | 1935 | Irrigation Water (Public Utility Tax) | Review and Clarify | $2,500,000 |
| 2008 | 1935 | Processing Horticultural Products (B&O Tax) | Continue | $3,500,000 |
| 2008 | 1943 | Farm Auction Sales (Sales/Use Tax) | Review and Clarify | $4,100,000 |
| 2009 | 1935 | Feed and Seed (Sales/Use Tax) | Continue | $144,000,000 |
| 2009 | 1949 | Flour and Oil Processors (B&O Tax) | Review and Clarify | $832,000 |
| 2009 | 2000 | Field Burning Equipment (Sales/Use Tax) Expired 1/01/2011 | Allow to Expire | $0 |
| 2010 | 1943 | Fertilizer and Chemical Sprays (Sales/Use Tax) | Continue | $166,600,000 |
| 2010 | 1945 | Breeding Livestock, Cattle, and Milk Cows (Sales/Use Tax) | Continue | $19,792,000 |
| 2010 | 1961 | Farm Machinery Sold to Nonresidents (Sales Tax) | Continue | $9,900,000 |
| 2010 | 1961 | Poultry Used in Production (Sales/Use Tax) | Continue | $462,000 |
| 2010 and 2014 | 1959 | Seafood Product Processing (B&O Tax) Includes 2 preferences | Review and Clarify | $3,500,000 |
| 2010 and 2014 | 1965 | Fresh Fruit and Vegetable Processing (B&O Tax) Includes 2 preferences | Review and Clarify | $39,300,000 |
| 2010 and 2014 | 2001 | Dairy Product Processing (B&O Tax) Includes 4 preferences | Review and Clarify | $9,100,000 |
| 2011 | 1967 | Meat Processors (B&O Tax) | Review and Clarify | $30,500,000 |
What State Business-Related Taxes Do Farmers Pay?
Farmers pay state taxes on some of their business activities and purchases, including:
- B&O tax on sales of agricultural products directly to consumers;
- Sales and use tax on purchases of new and used farm machinery and equipment not specifically exempted; and
- Sales and use tax on purchases of supplies, tools, and equipment not specifically exempted.
When Are Farmers “Price Takers”?
Economic literature often describes farmers as “price takers” rather than “price makers.” This is because most agricultural commodity prices are dictated by the national or international market, not by the producer. Thus, farmers that produce commodities generally are not able to set their prices.
When Are Farmers “Price Makers”?
Farmers that produce a differentiated product or that produce a large share of the total product may be able to influence the price they receive for their product, and would be considered “price makers.” In addition, some commodities may be withheld from the market until prices increase. In fact, withholding the commodity may have the impact of reducing the available supply, which in turn may increase prices.
What Are “Commodities” and “Differentiated Products”?
Commodities and differentiated products are at opposite ends of the product spectrum.
- A product is a commodity when all units of production are identical and have no different features, flavors or characteristics, regardless of who produces them. Examples include wheat, apples, milk, and chicken meat.
- A product is a differentiated product when it is different than those offered by competitors. Examples might include a special hybrid of wheat, organic honey crisp apples, organic milk, or free range, organic chicken meat.
Farmers with the least capacity to influence prices they receive are those that produce limited amounts of undifferentiated commodities that must be sold at a certain time. For instance, this would include smaller producers of fresh milk that must be sold soon after it is produced.
There are currently several federal risk management programs intended to provide financial stability for farmers in Washington. These programs are designed to lessen the financial impact of variations in commodity prices or losses from natural causes.
- Federal crop insurance: This is the major USDA program that helps farmers manage risks of crop losses due to bad weather, plant diseases, and other natural hazards. Established in the 1930s to cover yield losses from natural causes, the program was expanded and premium subsidies increased in the early 1980s.
Revenue insurance was introduced in the mid-1990s to pay when gross revenue (yield times price) falls below a specified level. Revenue insurance is now the most popular form of insurance.
More than 80 percent of the major U.S. crop acreage planted is insured under this program. Federal crop and revenue insurance are not subject to payment limitations or adjusted gross income eligibility limits. Under the current premium subsidy structure, about 62 percent of total premiums is paid by the federal government on behalf of insured farmers. In addition, administrative and operating subsidies are paid to insurance companies that sell and service these policies.
- Supplemental Coverage Option (SCO): Introduced in the Agricultural Act of 2014, SCO offers farmers additional insurance coverage for losses that fall under the levels generally covered by standard crop insurance policies and will be available beginning with the 2015 crop year. Like traditional crop insurance, SCO is not subject to payment limitations or adjusted gross income eligibility limits.
- Price Loss Coverage (PLC) program: New in the Agricultural Act of 2014, PLC provides payments to farmers of wheat, feed grains, rice, oilseeds, peanuts, and other covered commodities on a commodity-by-commodity basis when market prices fall below a congressionally established reference point.
- Agricultural Risk Coverage (ARC) program: Also new in the Agricultural Act of 2014, ARC provides payments for covered commodities on a commodity-by-commodity basis when county crop revenue (actual average yield times national farm price) drops below 86 percent of benchmark revenue. Farmers may choose to participate in ARC based on individual farm revenue instead of county revenue.
- Noninsured assistance program (NAP): NAP provides payment to farmers of crops when crop insurance is unavailable in that county.
- The Livestock Forage Disaster Program, the Livestock Indemnity Program, the Emergency Assistance for Livestock, Honey Bees, and Farm Raised Fish, and the Tree Assistance Program: These programs provide payments to farmers of eligible commodities for losses incurred as a result of diseases, adverse weather, or other environmental conditions.
- Marketing assistance loans: This program allows farmers to obtain a loan to facilitate holding some or all of their commodity. The loan proceeds help the farmer pay bills when they come due without selling at harvest time, when prices tend to be lowest. Farmers pledge their crop as collateral. Later, when market conditions may be more favorable, farmer may sell the crop and repay the loan at a lower interest rate.