JLARC Final Report: 2016 Tax Preference Performance Reviews
Report 17-02, January 2017
Timber and Wood Products | B&O Tax; Real Estate Excise Tax
- Summary of this Review
- Details on this Preference
- Recommendations and Agency Response
- How We Do Reviews
- More about this Review
Overview
| The Preference Provides | Tax Type | Estimated Biennial Beneficiary Savings |
|---|---|---|
This review covers two tax preferences:
The preference is scheduled to expire July 1, 2024.
|
B&O RCW 82.04.260(12) Real Estate Excise RCW 82.45.195 |
Timber and Wood Products Reduced B&O Tax Rate $30.6 million REET Exemption $978,000 |
| Public Policy Objective |
|---|
| The Legislature did not state the public policy objective for these preferences.
Timber and Wood Products Reduced B&O Tax Rate JLARC staff infer the public policy objectives were to:
JLARC staff infer the public policy objective was to help Washington’s wood products and timber industry adjust to structural changes in the industry resulting from federal tax treatment changes and the stock market. |
| Recommendations |
|---|
|
Legislative Auditor’s Recommendations
Timber and Wood Products Reduced B&O Tax Rate Review and Clarify: While it is reducing the cost of business, it is unclear how it is impacting employment and competitiveness. As part of the clarification, the Legislature should provide a performance statement identifying the public policy objectives and providing targets and metrics to measure whether the objectives have been achieved. Standing Timber REET Exemption Continue: The exemption is achieving the inferred objective of helping Washington’s wood products and timber businesses adjust to structural changes in the industry. Commissioner Recommendations: Standing Timber REET Exemption The Commission endorses the Legislative Auditor’s recommendation without comment. Timber and Wood Products Reduced B&O Tax Rate The Commission endorses the Legislative Auditor’s recommendation. The preference for timber and wood products may be helping offset environmental costs not borne by foreign competitors. The Legislature should review and clarify the preference, to provide a more measurable performance statement. As it undergoes this review, the Legislature should also measure the tax burden of this extractive and manufacturing industry and consider whether there is a disproportionate burden of B&O tax that is not faced by other industries or its competitors in other taxing jurisdictions. |
- What is the Preference?
- Legal History
- Other Relevant Background
- Public Policy Objectives
- Are Objectives Being Met?
- Beneficiaries
- Revenue and Economic Impacts
- Other States with Similar Preference?
- Technical Appendix 1: Timber-Industry Worker Productivity
- Technical Appendix 2: REMI Overview
- Technical Appendix 3: REMI Analyses for Timber
- Applicable Statutes
This review covers two tax preferences provided for various activities related to Washington’s timber and timber product manufacturing and wholesaling industries:
- A preferential business and occupation (B&O) tax rate for a number of different timber industry-related activities, including cutting trees, turning timber into timber products like dimensional lumber or pulp, and turning timber products into other products like paper; and
- A real estate excise tax (REET) exemption for sales of standing timber (but not land) to be cut within 30 months of the sale.
| Activity | Preferential B&O Rate* | Rate Without the Preferences |
|
|---|---|---|---|
| Timber and Wood Products Activities Preferential B&O Tax Rate | |||
| Extracting timber (e.g., cutting, felling or taking trees) | Base Rate + Surcharge Total Rate |
0.2904% 0.052% 0.3424% |
0.484% |
| Manufacturing or processing for hire timber into timber products or wood products (e.g., manufacturing timber into wood chips, sawdust, or dimensional lumber) | Base Rate + Surcharge Total Rate |
0.2904% 0.052% 0.3424% |
0.484% |
| Manufacturing timber products into other timber products or wood products (e.g., manufacturing wood chips into particle board; manufacturing pulp into paper or paper products) | Base Rate + Surcharge Total Rate |
0.2904% 0.052% 0.3424% |
0.484% |
Wholesale sales of:
|
Base Rate + Surcharge Total Rate |
0.2904% 0.052% 0.3424% |
0.484% |
| Sales of standing timber(but not land) that the buyer must cut within 30 months of the sale | Base Rate + Surcharge Total Rate |
0.2904% 0.052% 0.3424% |
Without preference, subject to combined state and local REET. Combined rate in most counties is 1.55% or 1.78%. |
Source: JLARC staff analysis of RCW 82.04.260(12)(a)-(d).
The real estate excise tax (REET) exemption works in tandem with one part of the B&O preference. The preferences apply to the situation where an owner sells standing timber that the buyer must cut down within 30 months. Without the REET exemption, the seller of the timber would have to pay REET on the gross sales amount. The combined REET rate in most counties is 1.53 or 1.78 percent. With the REET exemption and the B&O preference, the timber seller pays B&O tax instead of REET on the gross sale amount, at the reduced rate of 0.2904 percent combined with the surcharge for a total rate of 0.3424 percent.
Both the preferential 0.2904 percent B&O tax rate and the 0.052 percent surcharge are scheduled to expire July 1, 2024. The standing timber REET exemption does not have a stated expiration date, but it applies only to standing timber sales subject to the preferential B&O tax rate. If the B&O tax preferential rate for sales of standing timber expires, the REET preference would no longer apply.
Most businesses using the B&O tax preference (except for those qualifying as small harvesters) are required to complete an Annual Survey with the Department of Revenue (DOR). The Annual Survey provides information on the amount of the tax preference realized by the business, as well as on their number of employees, employee wages, and benefits offered. Small harvesters are not required to file an Annual Survey or Annual Report.
Prior to 2006
Before 2006, extracting, wholesale sales, and manufacturing of timber and wood products were taxed in the general manner prescribed under B&O tax law or REET.
|
Activity |
Tax Treatment Prior to 2006 |
|
Sales of standing timber |
State and local REET – combined rates varied, but rate for most counties was 1.53% or 1.78% |
|
Extracting (severing) timber |
Extracting B&O tax - 0.484% |
|
Manufacturing timber into timber products or wood products |
Manufacturing B&O tax - 0.484% |
|
Manufacturing timber products into other timber products or wood products |
Manufacturing B&O tax - 0.484% |
|
Wholesale sales of timber extracted by, or timber products or wood products, form timber, or other timber products manufactured by the seller |
Wholesaling B&O tax - 0.484% |
2006
The Legislature enacted a reduced B&O tax rate for the following activities:
- Extracting or extracting for hire timber
- Manufacturing or processing for hire of timber into timber products or wood products
- Selling timber by the extractor at wholesale
- Selling timber products or wood products manufactured by the seller at wholesale
The preference was phased in, with a 0.4235 percent rate applying for the first year (July 1, 2006, to June 30, 2007), and a 0.2904 percent rate applying after.
The Legislature added a surcharge of 0.052 percent to the 0.2904 preferential rate to help the state fund implementation of the Forest and Fish Report. The effective B&O tax rate after adding in the surcharge was 0.3424 percent. Application of the surcharge began in July 2007 and can be suspended based on criteria established in statute.
The Report's production was a joint effort by federal, state, and tribal governments, and the timber and fishing industries. The effort was intended to develop and implement laws, rules, and programs to comply with the Endangered Species Act, restore and maintain minimum riparian habitat to support a harvestable supply of fish, meet Clean Water Act standards, and keep the timber industry economically viable.
The Legislature established a July 1, 2024, expiration date for the preferential rate and surcharge. Businesses using the preferential rate were required to complete an Annual Survey with the Department of Revenue (DOR). The Survey provides information on the amount of the tax preference realized by the business, as well as on their number of employees, employee wages, and benefits offered.
2007
The Legislature added the real estate excise tax (REET) preference exempting sales of standing timber (but not the land) from REET when the timber was to be cut within 30 months of sale. These sales were instead subject to B&O tax at the preferential rate.
As part of the same bill, the Legislature expanded and modified the preferential 0.2904 B&O tax rate (and surcharge) in the following ways:
- Expanded the preferential rate (and surcharge) to apply to sales of standing timber sold separately from the land when the buyer cuts the timber within 30 months of the sale.
- Within the category of “manufacturing timber products into other timber or wood products”:
- Added “manufacturing using short rotation hardwood, pulp from reclaimed paper or paper products” to the eligible activities, and
- Eliminated “manufacturing products using recycled paper products” from eligibility.
- Defined “paper and paper products” and excluded books, newspapers, magazines, and other printed materials from eligibility.
2008
The Legislature expanded the preference to add “recycled paper” as qualifying timber products and “biocomposite surface products” as qualifying wood products. The provisions were made retroactive to July 1, 2007. The prime sponsor noted the legislation impacted only one known firm. The company thought the preference as enacted in 2006 applied to it, but were instructed otherwise by DOR.
2013
As directed by statute, DOR suspended the B&O tax surcharge from February 28, 2013, through June 30, 2013, (the remainder of the 2011-13 biennium) because receipts in the Forest and Fish Account fund exceeded the $8 million biennial limit established in statute. During this period, beneficiaries paid the B&O tax rate of 0.2904 percent. The surcharge was reinstated July 1, 2013, re-establishing the effective rate at 0.3424 percent.
Definitions
| Item | Defined in statute as: |
|---|---|
| Timber | Forest trees, standing or down, on private or publicly owned land. The definition specifically excludes Christmas trees cultivated through agricultural methods and short-rotation hardwoods. |
| Timber products |
|
| Wood products | Paper and paper products; dimensional lumber; engineered wood products such as particleboard, oriented strand board, medium density fiberboard, and plywood; wood doors; wood windows; and biocomposite surface products. |
| Paper and paper
products (A subset of wood products) |
Products made of interwoven cellulosic fibers held
together largely by hydrogen bonding, including: newsprint; office, printing,
fine, and pressure-sensitive papers; paper napkins, towels, and toilet
tissue; kraft bag, construction and other kraft industrial papers; paperboard,
liquid packaging containers, containerboard, corrugated, and solid-fiber
containers including linerboard and corrugated medium; and related types of
cellulosic products containing primarily, by weight or volume, cellulosic
materials. Specifically excludes: books, newspapers, magazines, periodicals, and other printed publications, advertising materials, calendars, and similar printed materials. |
| Biocomposite surface products | Surface material products containing, by weight or volume, more than 50% recycled paper and that also use nonpetroleum-based phenolic resin as a bonding agent. |
| Recycled paper | Paper and paper products with 50% or more of their fiber content from postconsumer waste. |
B&O Tax Surcharge Funds Forest and Fish Support Account
Receipts from the surcharge (0.052 percent) are deposited into the Forest and Fish Support Account established under RCW 76.09.405. These funds are used to implement adaptive management and other recommendations to improve riparian habitat from the legislatively mandated Forests and Fish Report.
Statute requires the surcharge be suspended if either of the following events occur:
- Receipts from the surcharge total at least $8 million during any fiscal biennium; or
- The Office of Financial Management certifies that the federal government has appropriated at least $2 million for federally recognized Indian tribes in Washington in any federal fiscal year for participation in Forest and Fish Report-related activities.
Other Tax Preferences Available to the Timber Industry, and Timber Product and Wood Product Manufacturers
| Began in: | Type: | Restrictions on Use: | Items Impacted: | Expiration Date? | JLARC Staff Review | |
|---|---|---|---|---|---|---|
| Timber Property Tax Exemption | 1971 (federal and private land)
2004 (state land) |
State and local property taxes. (Timber is instead subject to 5% timber excise tax at the time it is harvested) | None | Timber on land is not subject to property tax | None | Expedited review in 2010 |
| High Unemployment County Sales & Use Tax Deferral/ Waiver for Manufacturing Facilities | 1985 | Sales and use tax deferral and eventual exemption for construction and equipment purchased by new or expanding businesses in certain counties and all CEZs | Business must be located in a county with a high unemployment rate. Facility must stay operational seven years to receive full exemption | Construction of new structures and expansion of existing structures; industrial fixtures, equipment, and support facilities integral to the manufacturing operation | July 1, 2020 | None currently scheduled |
| Rural County & Community Empowerment Zone (CEZ) New Jobs B&O Tax Credit | 1986 | B&O tax credit for manufacturers and other businesses that hire workers in rural counties or CEZs | Business must be located in rural county or CEZ. Business must increase its employment by at least 15% within one year of first hiring to take the credit | Provides up to a $4,000 B&O tax credit for each new position created by manufacturing and other businesses that hire workers in rural counties or CEZs | None | Full review in 2013 |
| Small Harvester B&O Tax Deduction | 1990 | B&O tax deduction for up to $100,000 per year from gross receipts reported from timber harvesting activities | User must be a “small harvester” with 2 million board feet or less of harvested timber per calendar year | Eliminates B&O tax on the first $100,000 of gross income, but only available to persons harvesting 2 million or less board feet per CY | None | Expedited review in 2015 |
| Manufacturers’ Machinery and Equipment Sales & Use Tax Exemption | 1995 | Sales and use tax exemption | Available to any manufacturer. Not available for hand-powered tools, items with useful life less than one year, or buildings | Purchases of machinery and equipment used in manufacturing, processing, repair and maintenance work | None | Exempt from review per RCW 43.136.045 |
| Hog Fuel Sales & Use Tax Exemption | 2009 | Sales and use tax exemption for sales of hog fuel to produce electricity, steam, heat, or biofuel | If business closes a facility in WA and a job loss resulted, business must pay back last two years of exemptions claimed | Hog fuel is defined as wood waste and other wood residuals, including forest derived biomass; does not include firewood or wood pellets | June 30, 2024 | Full review in 2011 |
| Log Transportation Preferential Public Utility Tax (PUT) Rate | 2009-2013 (expired)
2015 (permanent) |
Reduced PUT rate (1.28%) for log transportation businesses | None | None | Legislature explicitly made permanent in 2015 | Expedited review in 2011 |
What are the public policy objectives that provide a justification for the tax preference? Is there any documentation on the purpose or intent of the tax preference?
The Legislature did not state a public policy objective when it provided the B&O tax preferential rate for various timber industry-related activities or the real estate excise tax (REET) exemption for sales of standing timber. The preferences were enacted prior to the Legislature’s requirement to provide a performance statement for each preference.
Reduced B&O Tax Rate for Timber and Wood Products
JLARC staff infer the public policy objectives for the reduced B&O tax rate were to:
- Reduce the cost of doing business for the timber industry,
- Which would help retain good paying jobs in rural areas, particularly manufacturing jobs, and
- Help the timber industry compete nationally and internationally.
These inferred objectives are based on statements made by the prime sponsors and industry representatives in 2006 and 2007 during legislative fiscal committee hearings. The Legislature did not identify any specific job targets or job quality measures.
Standing Timber REET Exemption
JLARC staff infer the public policy objective was to help Washington’s wood products and timber industry adjust to structural changes in the industry resulting from changes in federal tax treatment and the stock market. This is based on statements made by the prime sponsor and others in 2007 committee hearings.
The prime sponsor, as well as industry and Department of Revenue representatives, testified in legislative fiscal committee hearings that many large timber companies had changed their business structure to have separate corporate structures for their timber growing and their extracting and manufacturing activities. They indicated this restructuring was in response to federal tax changes and stock market pressures. Companies that restructured saw a change in tax treatment on timber sold from one related entity to another. Such sales became subject to REET. Previously such transactions made within a vertically integrated company had not been taxable under REET.
What evidence exists to show that the tax preference has contributed to the achievement of any of these public policy objectives?
There are mixed results for meeting the three inferred objectives of the timber and wood products reduced B&O rate.
The standing timber REET exemption is meeting its inferred objective of helping the timber industry adjust to structural changes in the industry by stabilizing the tax burden for these businesses as they restructured.
Reduced B&O Rate for Timber and Wood Products
There are mixed results for meeting the three inferred objectives for the timber and wood products preferential B&O rate.
1) Reduce Cost of Doing Business
The preference is achieving the inferred objective of reducing the cost of doing business in Washington for various timber industry activities by providing a lower B&O tax rate of 0.2904 percent. This is the same B&O tax rate provided to the aerospace manufacturing and aluminum manufacturing industries. However, the actual tax rate paid by timber preference beneficiaries is higher than that paid by aerospace or aluminum manufacturers due to the 0.052 percent surcharge used to fund the Forest and Fish Account.
2) Retain Good Jobs in Rural Counties
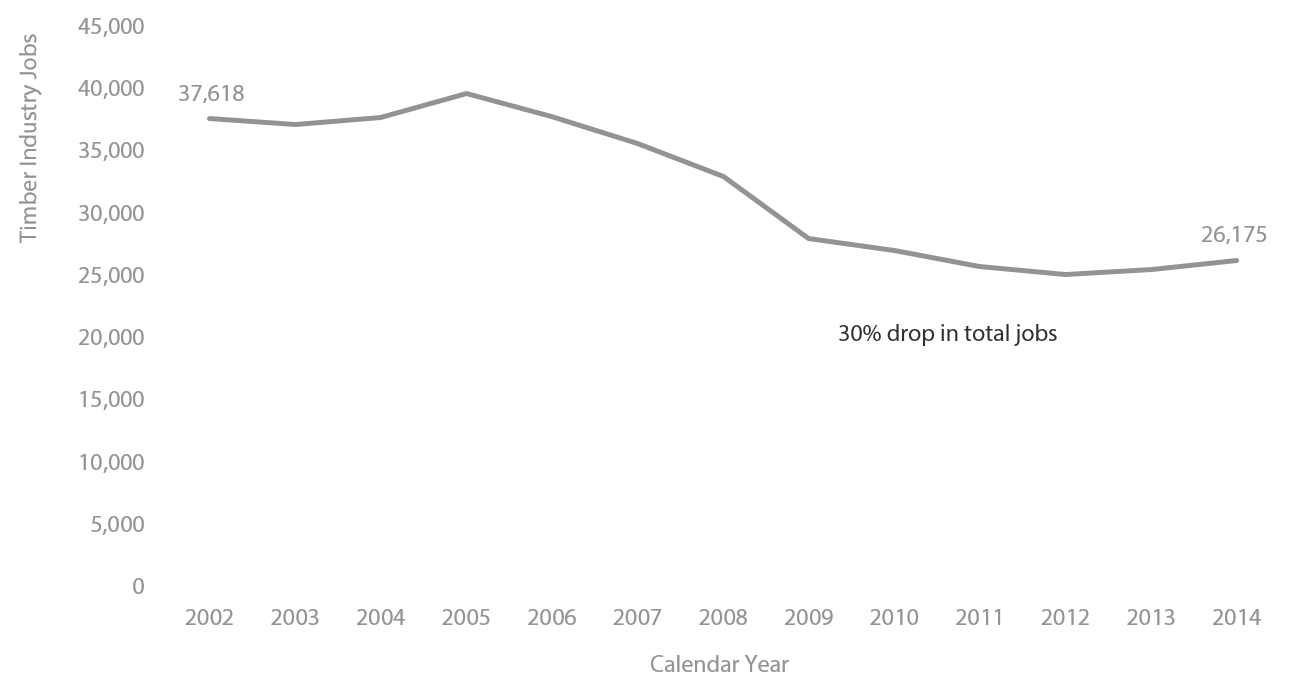
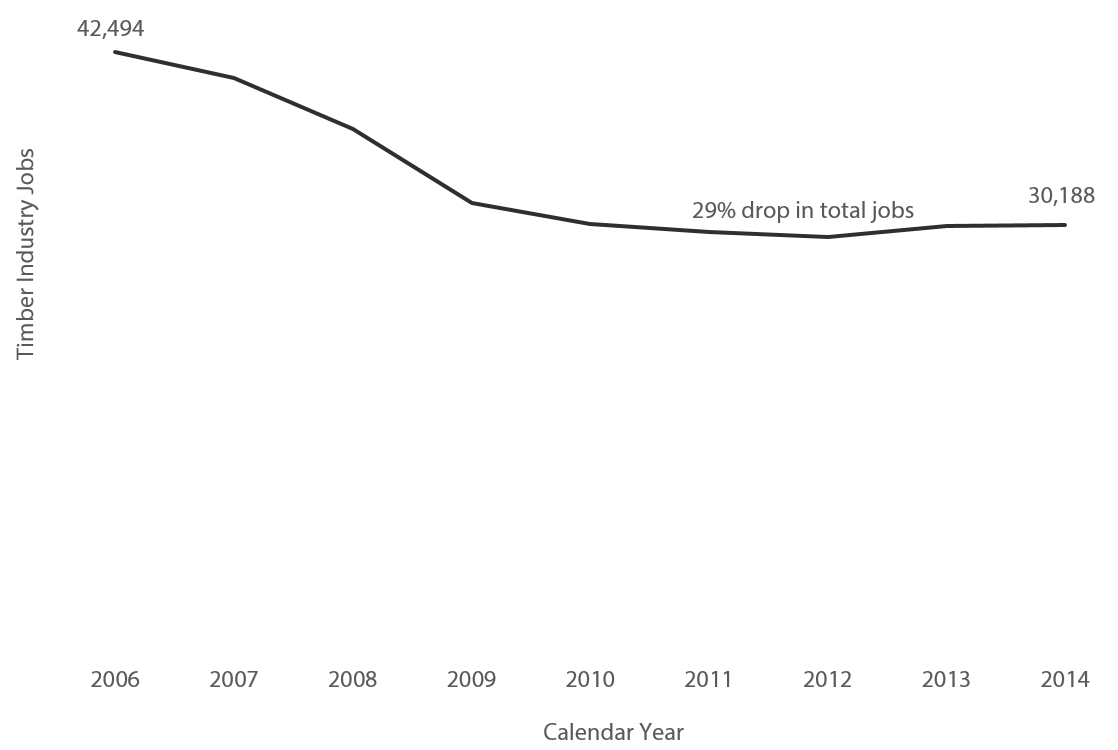
There are mixed results for the inferred objective of retaining good paying jobs in rural areas. Timber industry jobs decreased statewide from 2002 to 2014. This same trend was reflected in national timber industry job data.
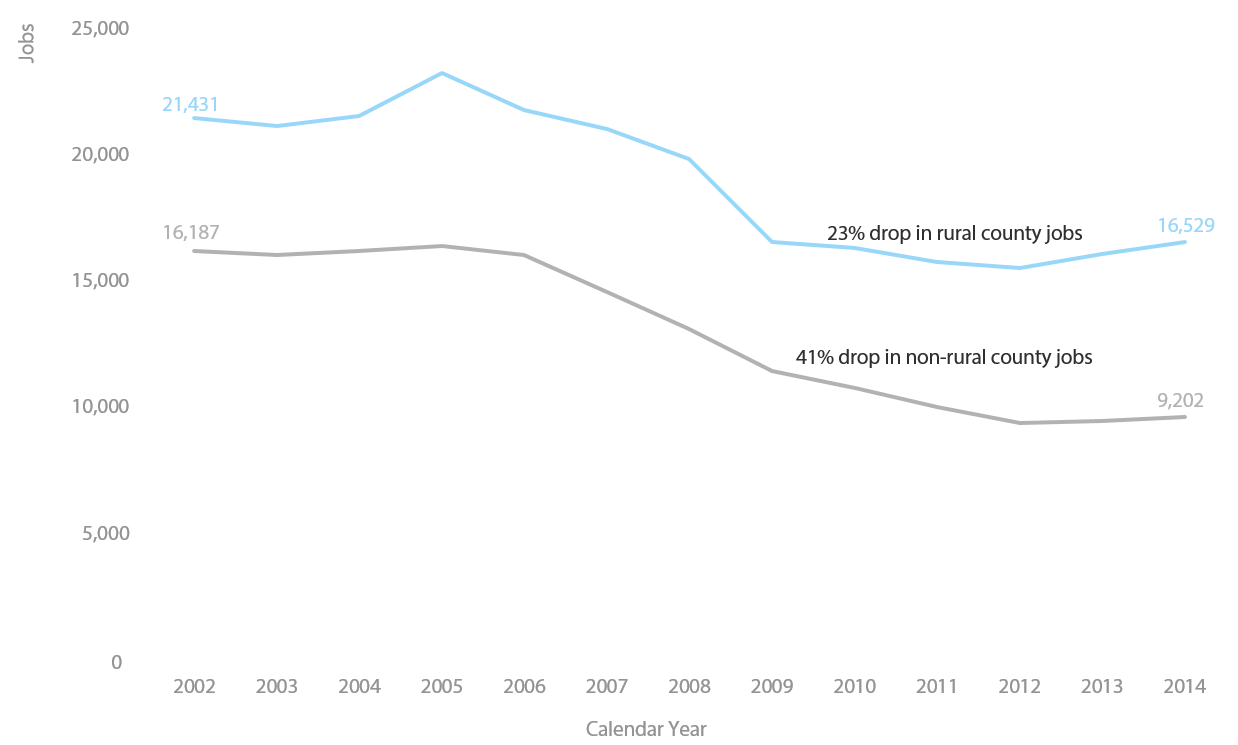
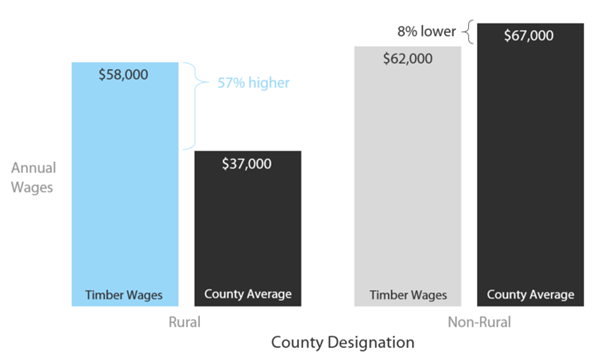
Rural counties experienced less of a job loss than non-rural counties. Also, for rural counties, the average annual wage for timber industry-related jobs is higher than the average wage in those counties. For non-rural counties, the average annual wage for timber industry-related jobs was below the average wages for those counties.
Washington Timber Industry Jobs Declined 30 Percent Between 2002 – 2014
JLARC staff analyzed Employment Security Department job data provided in general timber industry industrial classifications for logging, wood product manufacturing, and paper product manufacturing to track trends in timber industry-related jobs. From 2002 to 2014, there was a 30 percent overall loss of jobs in Washington in these industries. This trend is similar to the national rate of job loss for the same three timber industry-related industrial classifications, which was 27 percent from 2006 to 2014.
Less Job Loss in Rural Counties
JLARC staff also analyzed the difference between jobs lost or retained in rural counties versus those in non-rural counties. A “rural county” has a population density less than 100 persons per square mile or is smaller than 225 square miles. The eight counties that do not qualify as rural are: Benton, Clark, King, Kitsap, Pierce, Snohomish, Spokane, and Thurston.
The rate of job loss in rural counties was less than in more urban areas. Timber industry-related jobs dropped by 41 percent in non-rural counties from 2002 through 2014. Rural counties experienced a drop of 23 percent for the same period.
Timber Job Wages in Rural Counties Higher Than Average Wages
The prime sponsor and stakeholders testified in 2006 that the timber industry provided jobs with good wages in rural counties. JLARC staff examined wage detail for both rural and non-rural counties, comparing the annual wages for timber industry jobs to the average wages earned by all jobs in those counties.
In 2014, the last full year with available Employment Security wage data, the average annual timber industry wage in rural counties was 57 percent higher than the average wage earned in those counties ($58,000 vs. $37,000). However timber industry workers in the non-rural counties earned less than the average annual wage for those counties ($62,000 vs. $67,000).
Output per Timber Industry Worker Has Increased
The analysis above shows that jobs in the timber industry have declined since 2006 when the B&O preference was enacted. Given the decline in jobs, JLARC staff explored worker productivity in Washington’s timber industry. Output per worker has increased.
The analysis considers three key segments of the timber industry:
- Wood product manufacturing;
- Paper product manufacturing; and
- Timber harvest.
The worker productivity measure for wood and paper product manufacturing is gross domestic product (GDP) per job. GDP measures the value of goods and services produced. The worker productivity measure for timber harvest is the amount of timber harvested per logging job. The analysis looks at trends between 2006 and 2013 (the latest data available).
For the two segments where comparable federal information was available (wood product and paper product manufacturing), JLARC staff also examined national trends to see how Washington compares.
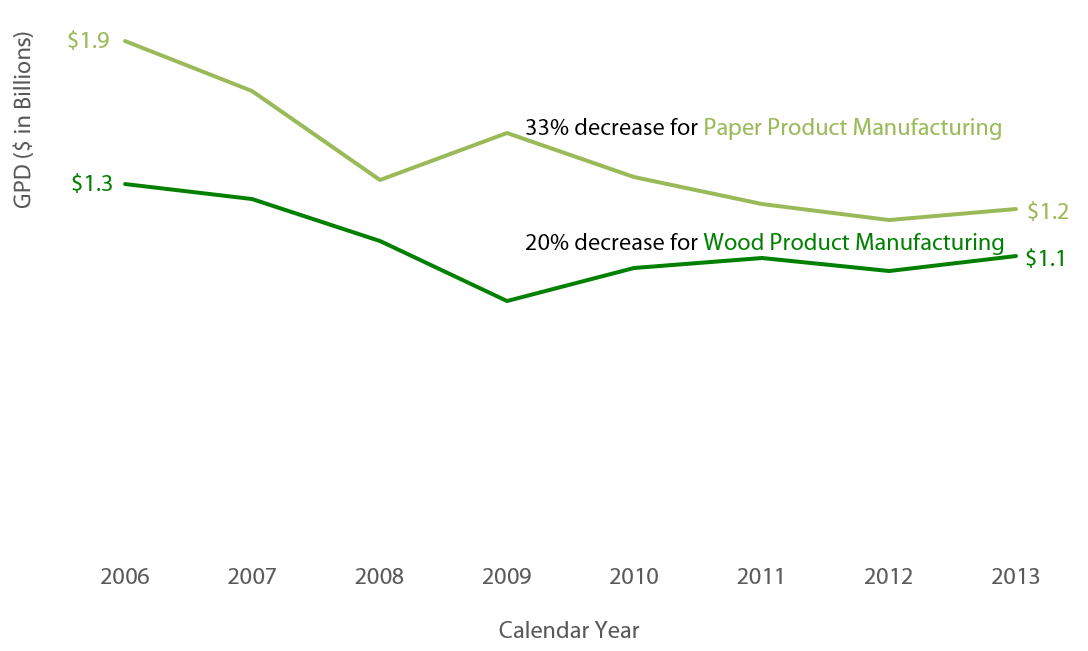
For wood product manufacturing,
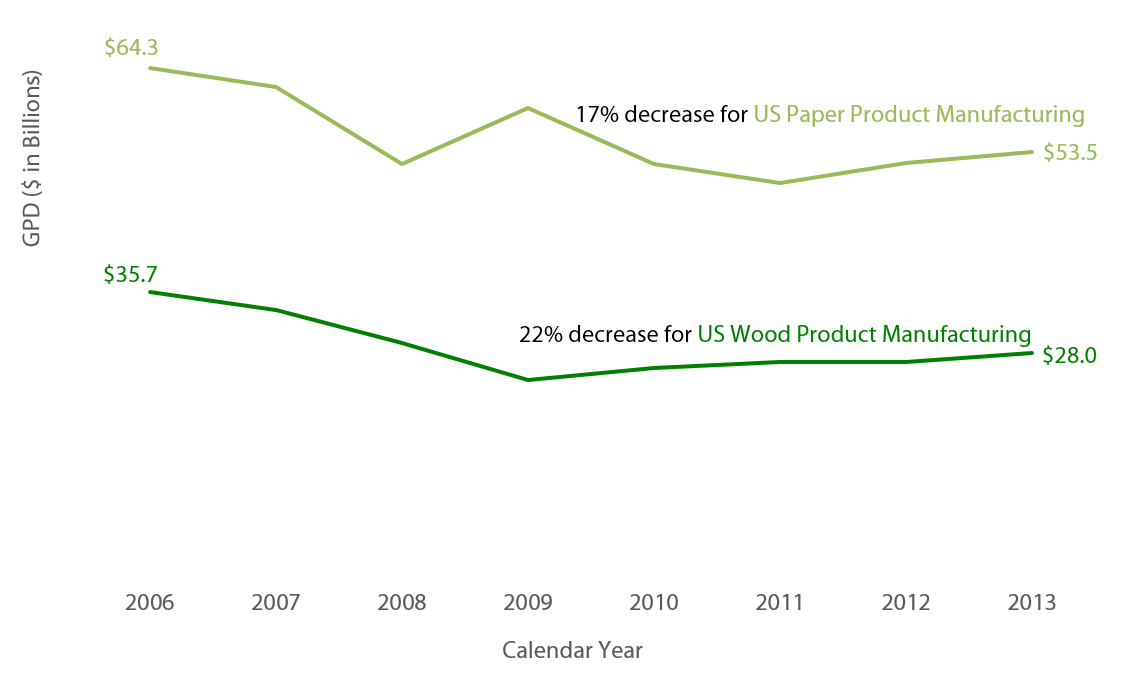
- Wood product GDP in Washington increased 16 percent, in contrast to a 12 percent decline at the national level;
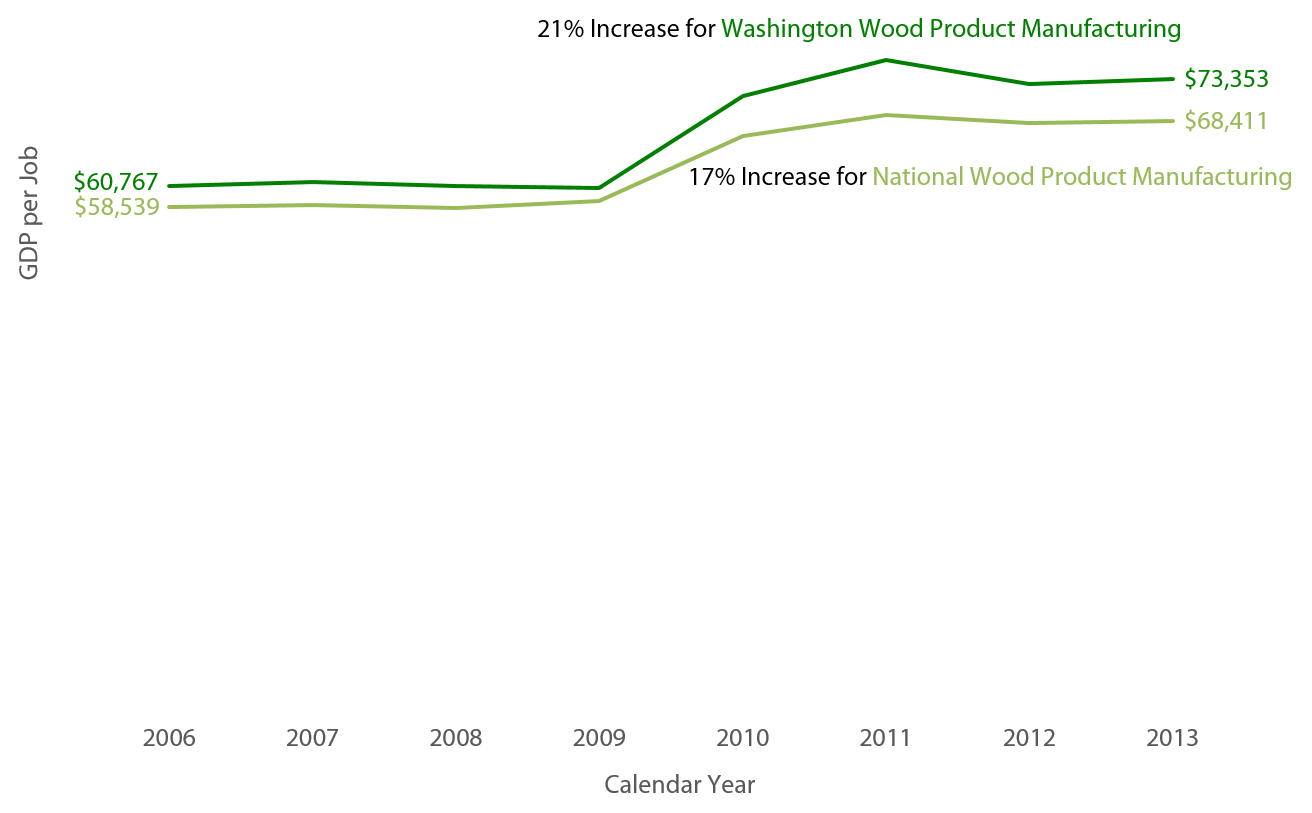
- Worker productivity increased at both the state and the national level, but more so in Washington. National GDP per job increased 40 percent, while GDP per job in Washington increased 78 percent.

For paper product manufacturing,
- Paper product GDP declined at both the national level (28 percent) and the state level (31 percent);
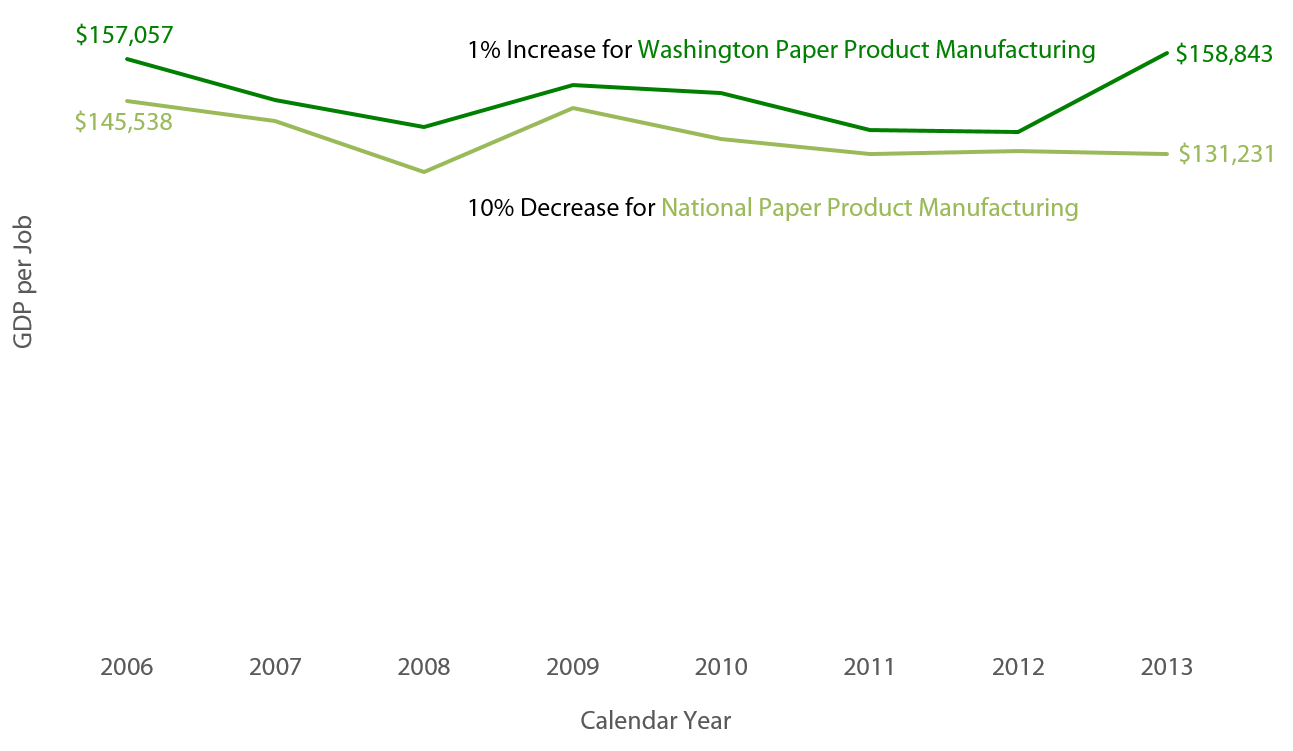
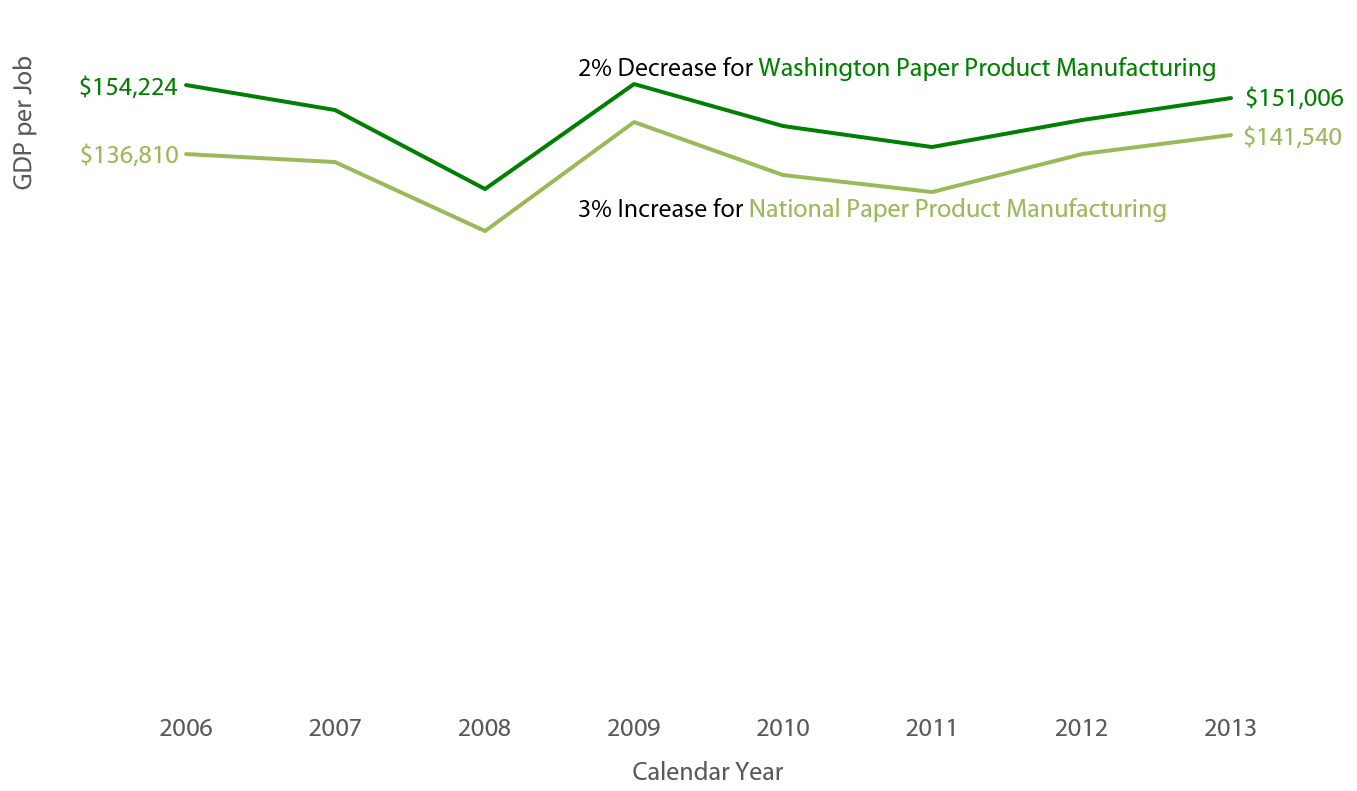
- Worker productivity increased at the state level and declined at the national level. National GDP per job decreased 10 percent, while GDP per job in Washington increased 1 percent.
For timber harvest,
- Statewide timber harvest declined 33 percent from 2006 to 2009, then slowly increased. As of 2013, the harvest level had not returned to 2006 levels;
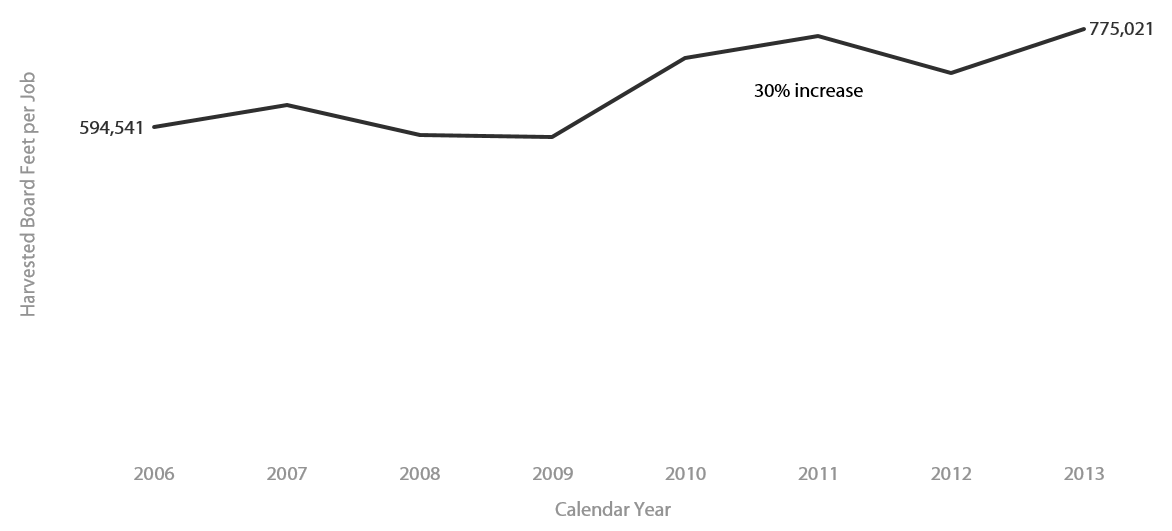
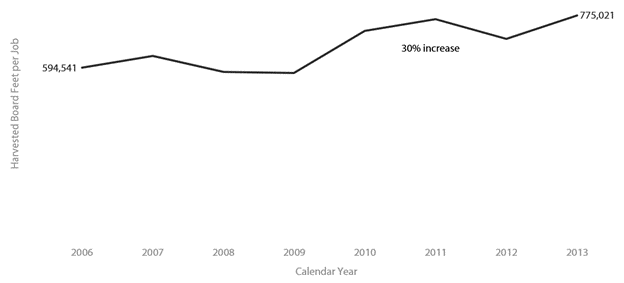
- Following the same pattern as wood and paper products, worker productivity has increased. The amount of timber harvested per forestry and logging job increased 30 percent.
See tab Technical Appendix 1 for additional detail and exhibits for the timber industry worker productivity analysis.
3) Help Washington’s Timber Industry Businesses Compete Nationally (and Internationally)
It is unclear if the preference has had an impact on Washington’s ability to compete nationally in timber industry-related activities.
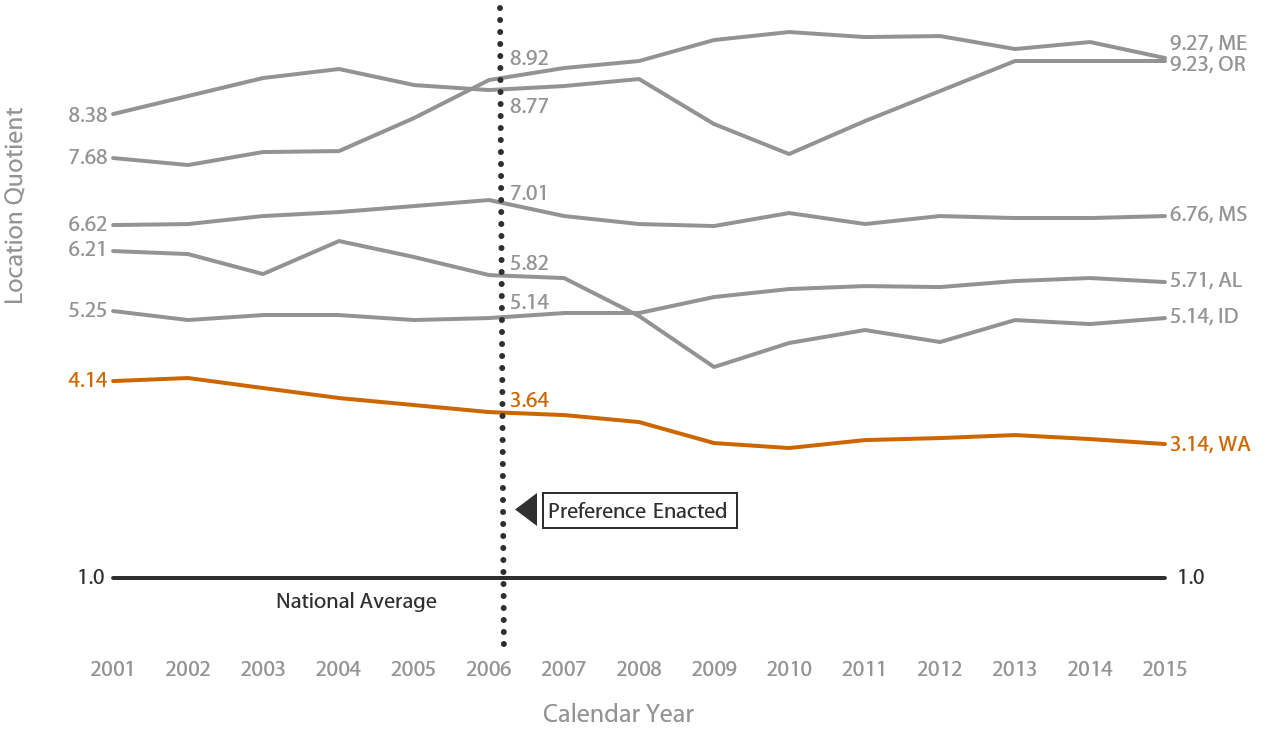
JLARC staff analyzed Washington’s competitive position by measuring employment concentration using federal Bureau of Labor Statistics location quotients, which are available for wood product manufacturing, paper product manufacturing, and forestry and logging industries. Location quotients compare a state’s share of employment in an industry to the total national share of employment in that industry. A location quotient of 1.0 means an industry is equally concentrated in the state as in the nation. A location quotient above 1.0 means the state has a greater share of employment.
From 2001 to 2015, Washington’s location quotient has remained flat and consistently above the national average for the wood products manufacturing industry. Since the preference was enacted in 2006, Washington’s share of employment has declined. Washington’s employment concentration in 2015 was 16th, with the top three states being Oregon, Idaho, and Alabama.
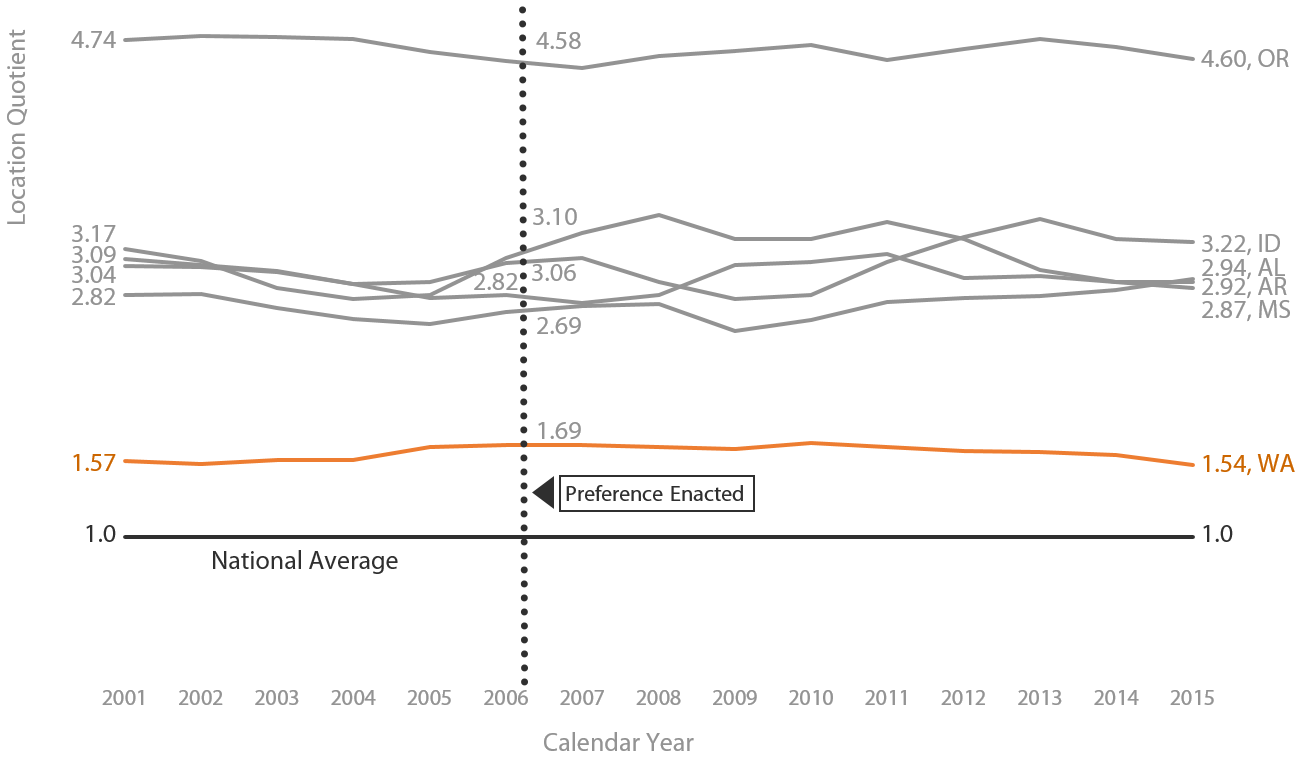
For the paper product manufacturing industry, Washington’s location quotient has declined from 2001 to 2015 from above the national average to slightly below it. Washington’s ranking recently slipped below Idaho and has consistently been below the states with the greatest employment concentration (Wisconsin, Maine, and Arkansas). In 2015, Washington’s concentration of employment was ranked 21st nationally, below Idaho (ranked 18th) and above Oregon (ranked 23rd).
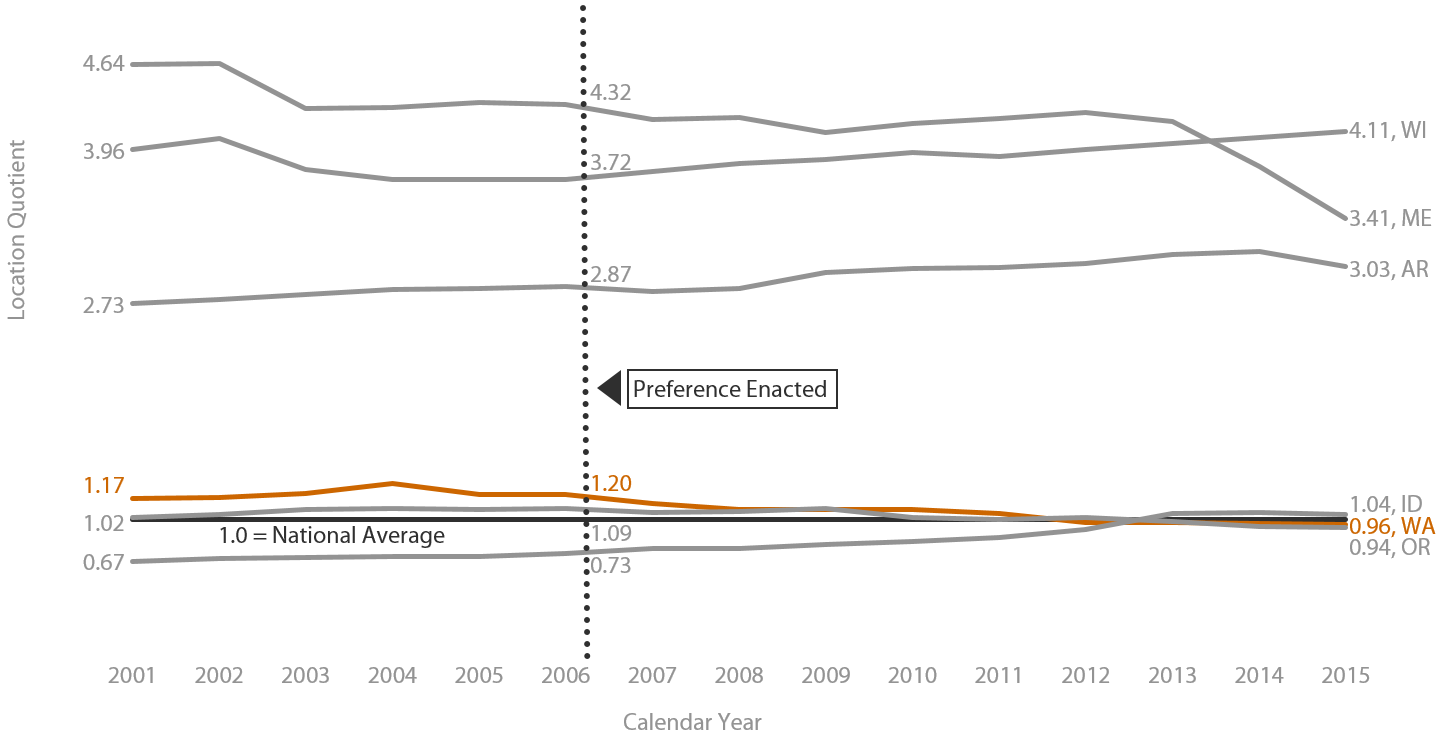
From 2001 to 2015, Washington’s location quotient declined but remained above the national average for the forestry and logging industry. Washington’s concentration of employment in the forestry and logging industry in 2015 was 9th, behind the top three states of Maine, Oregon, and Mississippi, and it was also behind Idaho (ranked 5th).
Location quotients are not available for comparisons with other countries.
Standing Timber REET Exemption (and Preferential B&O Tax)
The preference is meeting its objective of helping Washington’s wood products and timber industry adjust to structural changes in the industry and the stock market.
In response to federal tax changes, a number of large timber companies restructured their companies to separate their timber growing from their extracting and manufacturing activities. However, this restructuring made standing timber sales from one related entity to another subject to real estate excise tax (REET). Previously these transactions within a vertically integrated company had not been taxable under REET.
The standing timber REET exemption continued the prior tax treatment that large timber companies had received when their timber growing and harvesting operations were in the same company. In addition, small timber owners who had previously paid REET on their sales of standing timber were now exempt. All of these businesses became subject to B&O tax on the sales, stabilizing the amount of tax they pay to be more consistent with the tax treatment before restructuring.
To what extent will continuation of the tax preference contribute to these public policy objectives?
Continuation of the preferential B&O tax rate will continue to reduce the cost of doing business for beneficiaries of the tax preference. However, it is unclear to what extent continuation of the preference will contribute to retaining good jobs in rural areas or making Washington timber industry businesses competitive nationally or internationally.
Continuing the REET exemption for standing timber sales will continue to provide large timber companies with the same REET tax treatment they received prior to restructuring their companies. Smaller harvesters that paid REET prior to the preference also will continue to be exempt.
Who are the entities whose state tax liabilities are directly affected by the tax preference?
Direct beneficiaries of the B&O tax preference are businesses involved in extracting timber, and manufacturing, and wholesaling timber, timber products, or wood products. In Fiscal Year 2015, 1,129 businesses used the B&O tax preference.
Direct beneficiaries of the standing timber sales REET preference are businesses that sell standing timber apart from the land for harvest within 30 months. DOR data indicates 51 businesses used this preference in Fiscal Year 2015.
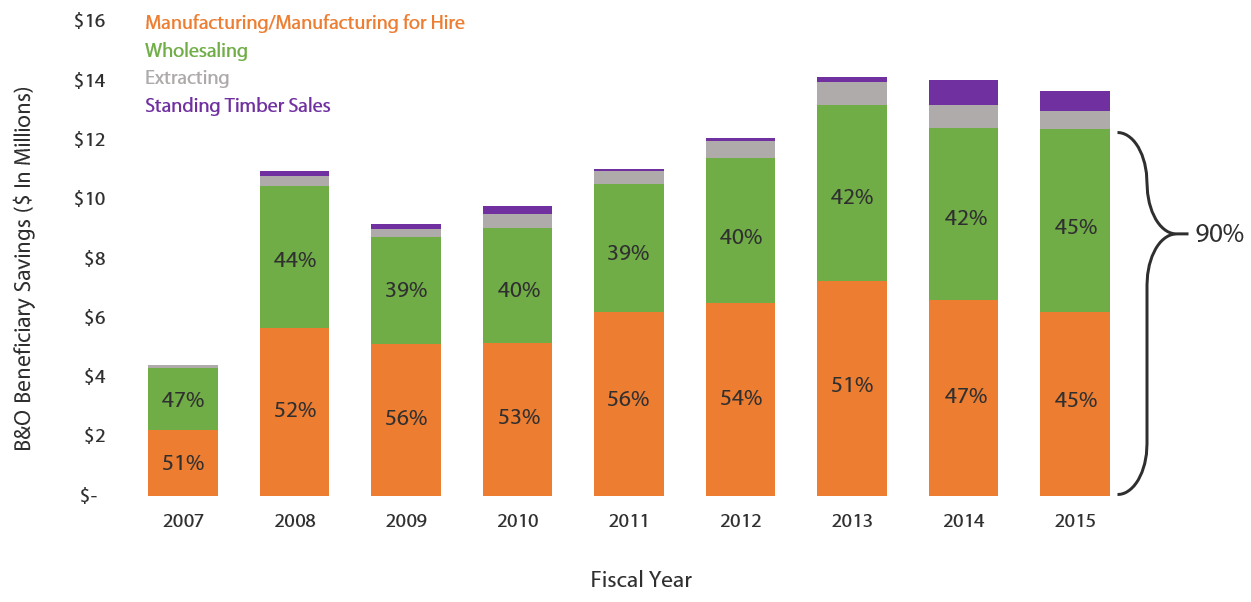
Since the B&O preference was enacted, businesses that manufacture timber or wood products and that make wholesale sales of timber or wood products that they manufacture have accounted for over approximately 90 percent of the total amount of the value of the tax preference.
What are the past and future tax revenue and economic impacts of the tax preference to the taxpayer and to the government if it is continued?
Preferential Timber and Wood Products B&O Tax Rate
JLARC staff estimate the direct beneficiary savings for the B&O preferential rate are $13.6 million in Fiscal Year 2015 and $30.6 million for the 2017-19 Biennium.
JLARC staff estimated the beneficiary savings by calculating the difference between the general B&O tax rate for extracting, manufacturing, and wholesaling (0.484 percent) and the sum of the preferential B&O tax rate (0.2904 percent) and the surcharge (0.052 percent).
|
Fiscal Year
|
Total Taxable Sales
|
Total Beneficiary Savings
|
|
2014 |
$9,392,640,000
|
$14,036,000 |
|
2015 |
$9,233,112,000
|
$13,642,000 |
|
2016 |
$9,806,499,000 |
$13,886,000 |
|
2017 |
$10,382,286,000 |
$14,701,000 |
|
2018 |
$10,786,768,000 |
$15,274,000 |
|
2019 |
$10,856,170,000 |
$15,372,000 |
|
2017-19 Biennium |
$21,642,938,000 |
$30,646,000 |
Standing Timber Sales REET Exemption
JLARC staff estimate the direct beneficiary savings for the REET exemption are $990,000 in Fiscal Year 2015 and $978,000 for the 2017-19 Biennium. Timber sales can fluctuate widely from year to year. Therefore, to estimate beneficiary savings for 2016 through 2019, JLARC staff used the historic average taxable standing timber sales from 2007 through 2015. These historic averages are lower than recent years’ sales.
|
Fiscal Year
|
Total Taxable Sales
|
State REET Exemption (1.28%)
|
Local REET Exemption (Average 0.45%)
|
LESS B&O Tax + Surcharge Paid (0.3424%)
|
Net Beneficiary Savings
|
|
2014 |
$89,716,000
|
$1,148,000 |
$404,000 |
$307,000 |
$1,245,000 |
|
2015 |
$71,320,000 |
$913,000 |
$321,000 |
$244,000 |
$990,000 |
|
2016 |
$35,228,000 |
$451,000 |
$159,000 |
$121,000 |
$489,000 |
|
2017 |
$35,228,000 |
$451,000 |
$159,000 |
$121,000 |
$489,000 |
|
2018 |
$35,228,000 |
$451,000 |
$159,000 |
$121,000 |
$489,000 |
|
2019 |
$35,228,000 |
$451,000 |
$159,000 |
$121,000 |
$489,000 |
|
2017-19 Biennium |
$70,455,000 |
$902,000 |
$318,000 |
$242,000 |
$978,000 |
If the tax preference were to be terminated, what would be the negative effects on the taxpayers who currently benefit from the tax preference and the extent to which the resulting higher taxes would have an effect on employment and the economy?
If the tax preference were terminated, current beneficiaries of the preferential rate would pay more B&O tax on their various extracting, manufacturing, and wholesaling activities. Businesses selling standing timber to be severed within 30 months would return to paying real estate excise tax on the gross sale amount, rather than B&O tax at a reduced rate.
The REMI analysis below estimates the potential effects that termination of these preferences would have on Washington’s employment and economy.
In addition, the 0.052 percent surcharge that is added to the preferential B&O tax rate would no longer be paid by beneficiaries. This would eliminate this funding source for the Forest and Fish Support Account.
For those preferences enacted for economic development purposes, what are the economic impacts of the tax preferences compared to the economic impact of government activities funded by the tax?
Results from the REMI Analysis
JLARC staff used Regional Economic Models, Inc.'s Tax-PI to estimate three measures of economic and fiscal impact for the timber and wood products B&O tax preferences. Specifically, we analyzed the effects of the tax preference on jobs, earnings, and state revenue for Calendar Years 2015 through 2024. This analysis includes both private and public sector economic impacts.
Tax-PI is an economic impact toll for evaluating the fiscal and economic effects and the demographic impacts of tax policy change.
See Technical Appendix 2 for an overview of the REMI model.
See Technical Appendix 3 for more information on how JLARC staff conducted the REMI analysis for this preference.
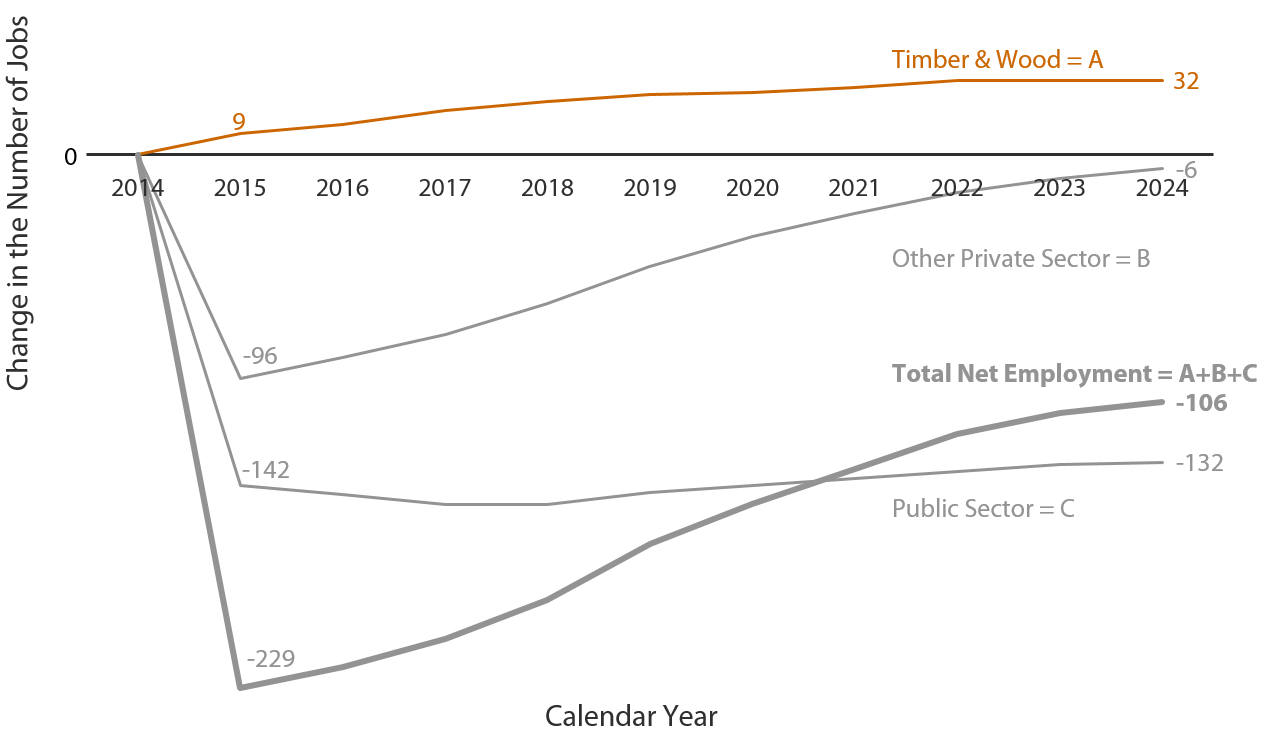
1. There is an estimated net decrease in jobs resulting from the tax preference
The exhibit below shows REMI's estimated jobs trends over a ten-year period related to the preferential B&O tax rate available for timber and wood products manufacturing activities. Each line shows the estimated change in employment, by category, related to the tax preference. A line above zero represents job gains and a line below zero represents job losses.
Overall, the net jobs trend statewide is negative, with an initial loss of 229 jobs in the first year and a loss of 106 jobs in 2024. The model estimates the timber and wood products industries experienced an initial increase of nine jobs in the first year and 32 jobs in 2024. Public sector employment drops by 142 jobs in the first year and stays near that level over the ten-year period. Finally, private non-farm employment, excluding timber and wood products employment, see an initial loss of 96 jobs and essentially recovers by 2024.
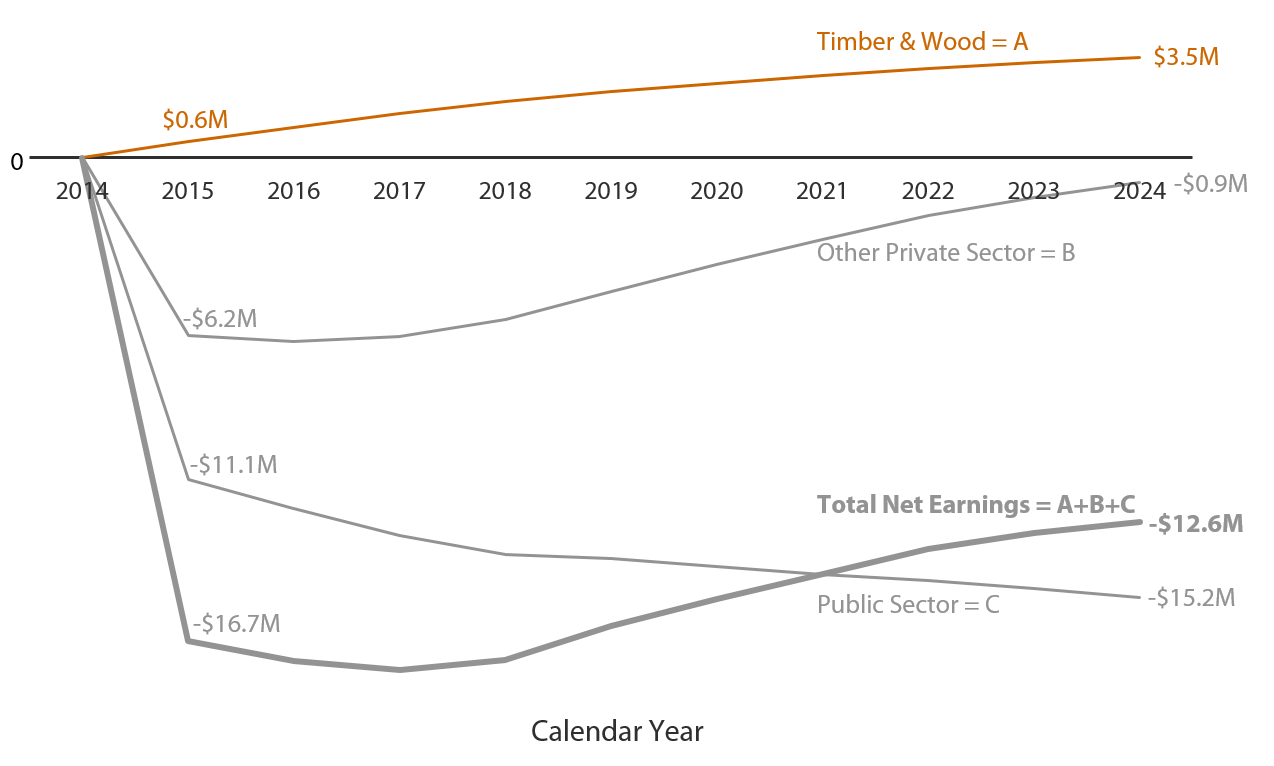
2. There is an estimated net reduction in employee earnings resulting from the tax preference
The exhibit below shows REMI's estimated earnings trends broken down by the same four groupings as the previous exhibit.
Overall, the net change in earnings is negative. The largest single year decrease in statewide earnings is in 2017, with a loss in earnings totaling $16.7 million. This loss is approximately $5 million less in 2024. The timber and wood products industries see a gain in earnings of $560,000 in the first year and $3.5 million in 2024, the expiration date of the preference. Public sector employees see a decrease in earnings of $11.1 million in the first year and $15.2 million in 2024 whereas other private sector, excluding timber and wood products employees, see earnings decrease $6.2 million in the first year and $0.87 million in 2024.
3. There is an estimated net reduction in tax revenue resulting from the tax preference
There is a net reduction in tax revenue to the state in addition to the initial loss due to the reduced B&O tax rate.
JLARC staff estimate that the tax preference results in a net annual reduction in all tax revenue of $15.9 million, on average, through 2024. This estimate accounts for taxes associated with direct, indirect, and induced effects of the tax preference.
|
Tax
Revenue Changes Due to Economic Activity Related to the Preference |
Estimated
10-Year Average |
|
Reduction in State Taxes Due to the Preferential Rate |
($15,400,000)
|
|
Increase in State Taxes Due to Increased Timber Production |
$434,000 |
|
Change in State Taxes Due to Reduced Government Spending |
($937,000) |
|
Net Change in State Tax Revenue |
($15,903,000) |
What Factors Help to Explain the Pattern of Results Reported?
The direct impact of the reduced B&O tax rate for timber and wood products industry-related activities on jobs is relatively small. This may be due to the small value of the tax preference recognized by each beneficiary.
In Fiscal Year 2014, for example, 1,117 taxpayers claimed the preference for a total savings of $14 million. The median beneficiary savings for businesses reporting under the preferential manufacturing B&O tax classification was $584. For businesses reporting under the preferential B&O extracting classification it was $243 and for businesses reporting under the preferential B&O wholesaling classifications it was $1,196, respectively.
Further, a reduction in state spending results in greater job loss because the activities funded by government spending are more labor intensive than the activities of wood and paper product manufacturing industries. For example, schools and prisons are less able to substitute machinery and equipment for teachers and prison guards. In the REMI model, labor compensation accounts for 54 percent of all public sector spending whereas labor compensation accounts for a smaller amount of spending in the timber and wood products industries. In the logging industry about 45 percent of all spending is on labor whereas the same value for the wood products manufacturing industry ranges between 23 and 31 percent and for the paper products manufacturing industry it is between 14 and 24 percent.
In contrast to state and local government jobs, timber extracting and timber and wood product manufacturing activities are more capital intensive. The earlier analyses looking at GDP per job in Washington showed increases in the productivity of workers in the timber industry, despite fewer industry jobs over time.
The reduction in private non-farm employment is concentrated most heavily in the construction and retail trade sectors. State and local government spending on goods and services creates jobs in the private sector, such as health care and construction. Reductions in government spending may result in private sector job losses in sectors that sell goods and services to government. Over time these sectors do rebound, but this may be largely related to more people moving into the state over time.
Do other states have a similar tax preference and what potential public policy benefits might be gained by incorporating a corresponding provision in Washington?
JLARC staff reviewed tax preferences provided for timber-related business activities in states with a high concentration of employment in logging, wood product manufacturing, and paper product manufacturing.
There are no preferences similar to Washington’s reduced B&O tax rate. However, in each state reviewed there were numerous economic development programs designed to encourage businesses to locate or expand operations and increase employment. While not specifically designed for timber-industry-related activities, the following programs could apply to timber industry-related manufacturing businesses.
| State | Economic Development Incentives |
|---|---|
| Alabama |
|
| Arkansas |
|
| Georgia |
|
| Idaho |
|
| Mississippi |
|
| Oregon |
|
Timber Industry Worker Productivity -- Summary
Jobs in the timber industry have declined since 2006 when the B&O preference was enacted. Given the decline in jobs, JLARC staff explored worker productivity in Washington’s timber industry. Output per worker has increased.
The analysis considers three key segments of the timber industry:
- Wood product manufacturing;
- Paper product manufacturing; and
- Timber harvest.
The worker productivity measure for wood product and paper product manufacturing is GDP per job. Gross domestic product (GDP) measures the value of goods and services produced. The worker productivity measure for timber harvest is the amount of timber harvested per logging job. The analysis looks at trends between 2006 and 2013 (the latest data available).
For the two segments where information was available (wood product and paper product manufacturing), JLARC staff also examined national trends to see how Washington compares.
For wood project manufacturing,
- Wood product GDP in Washington increased 16 percent, in contrast to a 12 percent decline at the national level;
- Worker productivity increased at both the state and the national level, but more so in Washington. National GDP per job increased 40 percent, while GDP per job in Washington increased 78 percent.
For paper product manufacturing,
- Paper product GDP declined at both the national level (28 percent) and the state level (31 percent);
- Worker productivity increased at the state level and declined at the national level. National GDP per job decreased 10 percent, while GDP per job in Washington increased 1 percent.
For timber harvest,
- Statewide timber harvest declined 33 percent from 2006 to 2009, then slowly increased. As of 2013, the harvest level had not returned to 2006 levels;
- Following the same pattern as wood and paper products, worker productivity has increased. The amount of timber harvested per logging job increased 30 percent.
Detail: GDP and GDP per Job for Wood Product and Paper Product Manufacturing
Industry-wide, Washington’s wood product manufacturing industry sector is faring better than the nation as a whole whereas paper product manufacturing is approximately even with the nation as a whole. While jobs are down both in-state and nationally, Washington’s production level has decreased, by a smaller percentage than the national production level.
From 2006 to 2013, the U.S. GDP for all industries increased 5 percent.
However, the national GDP for paper product manufacturing dropped by 28 percent, and the national GDP for wood product manufacturing dropped 12 percent during the same period.
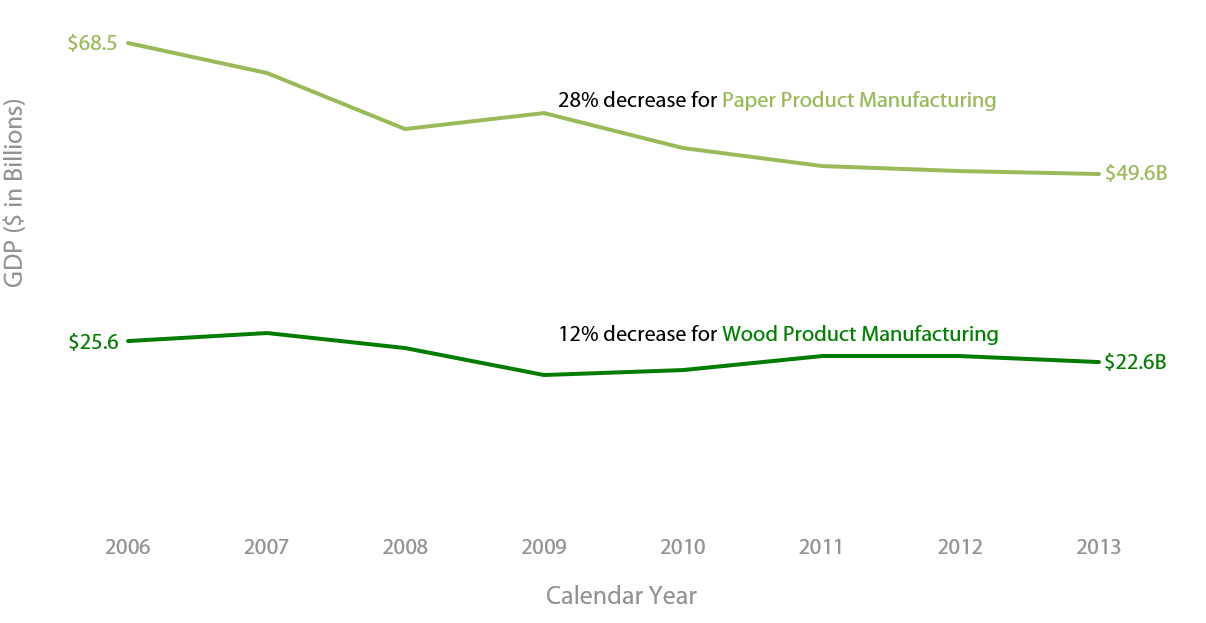
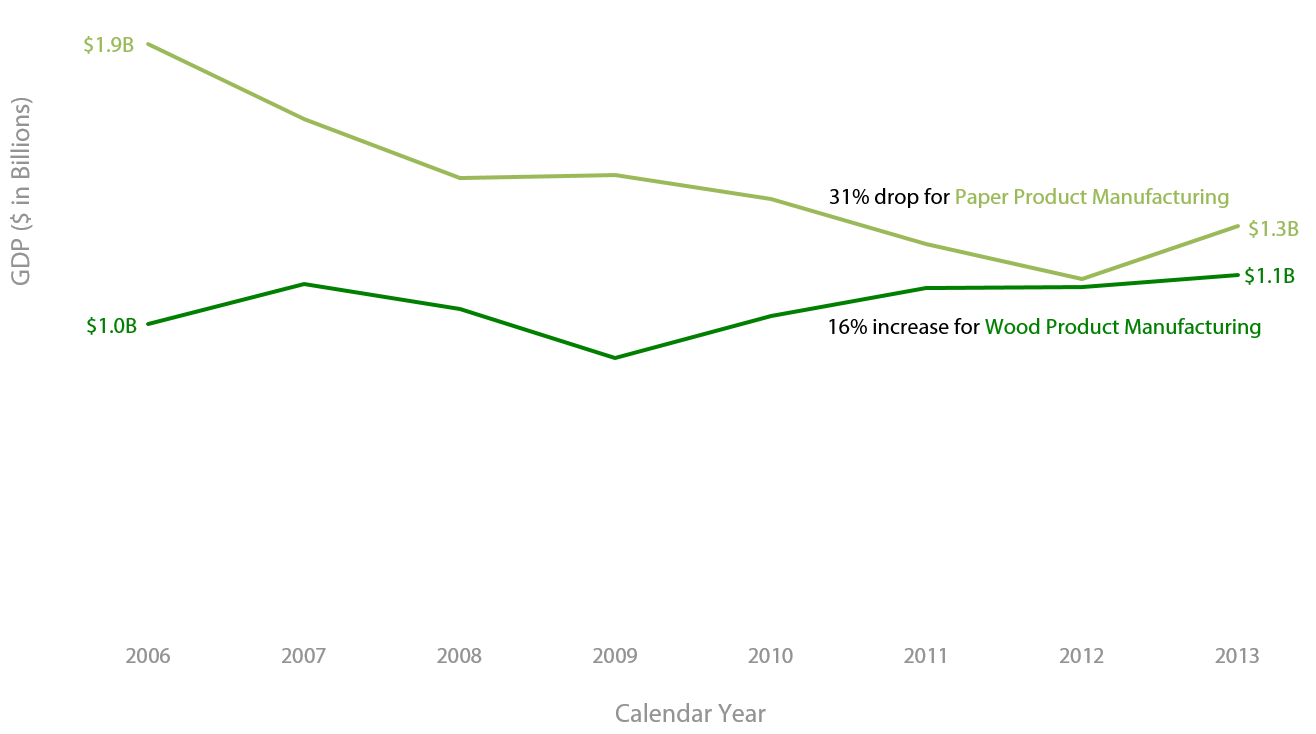
At the state level, Washington also saw a drop in GDP for paper product manufacturing. Counter to the national trend, Washington had an increase in GDP for wood product manufacturing. From 2006 to 2013, Washington’s GDP for all industries increased 12 percent from $335.9 billion to $374.7 billion. The Washington GDP for paper product manufacturing dropped by 31 percent, while the state’s wood product manufacturing GDP increased by 16 percent.
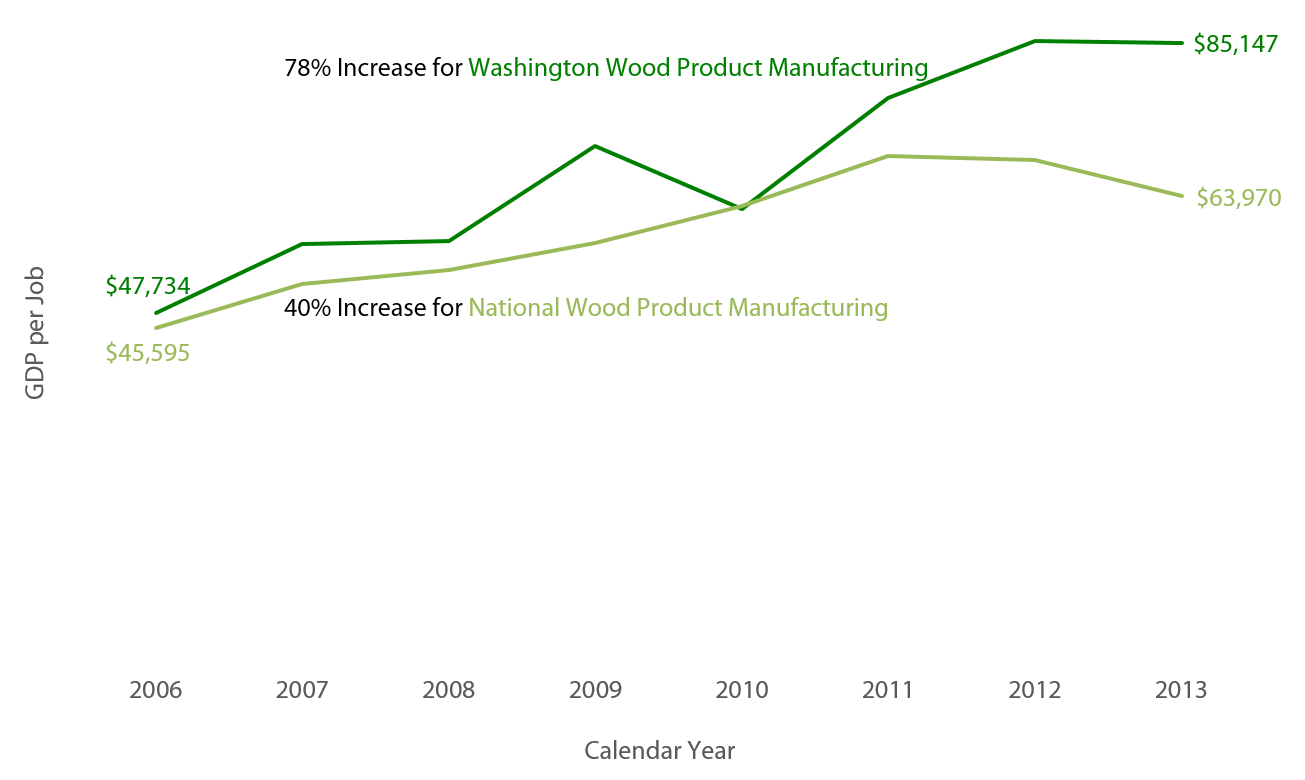
Gross Domestic Product per Job
JLARC staff also looked at the GDP per job on a national and the state level, to see how Washington compared to the national production per job in wood product and paper product manufacturing industries. We did this analysis in order to review the impact of the loss of jobs on wood product and paper product manufacturing production, both at the national level and in Washington. An increase in the GDP per job means that each job in that industry has increased its production.
National GDP per Job
On a national level, the GDP per job for both wood product and paper product manufacturing increased from 2006 to 2013, indicating that each job in these industries is producing more than it was in 2006.
- U.S. GDP per job for wood product manufacturing increased 40 percent.
- U.S. GDP per job for paper product manufacturing decreased 10 percent.
Washington GDP per Job
The GDP per job for both wood product and paper product manufacturing increased from 2006 to 2013, again indicating each job is producing more than it did in 2006.
- Washington’s GDP per job for wood product manufacturing increased 78 percent – from $47,734 to $85,147.
- Washington’s GDP for paper product manufacturing increased 1 percent – from $157,057 to $158,843 per job.

Timber Harvest Levels and Worker Productivity
There was no data series from the federal Bureau of Labor Statistics that allowed for a national and state GDP comparison for this segment of the industry. JLARC staff were able to find state sources to describe statewide timber harvest levels and timber harvested per logging job.
Statewide timber harvest levels dropped by 33 percent from 2006 to 2009, and have slowly recovered since. The number of board feet harvested in 2014 was still below that harvested in 2006.
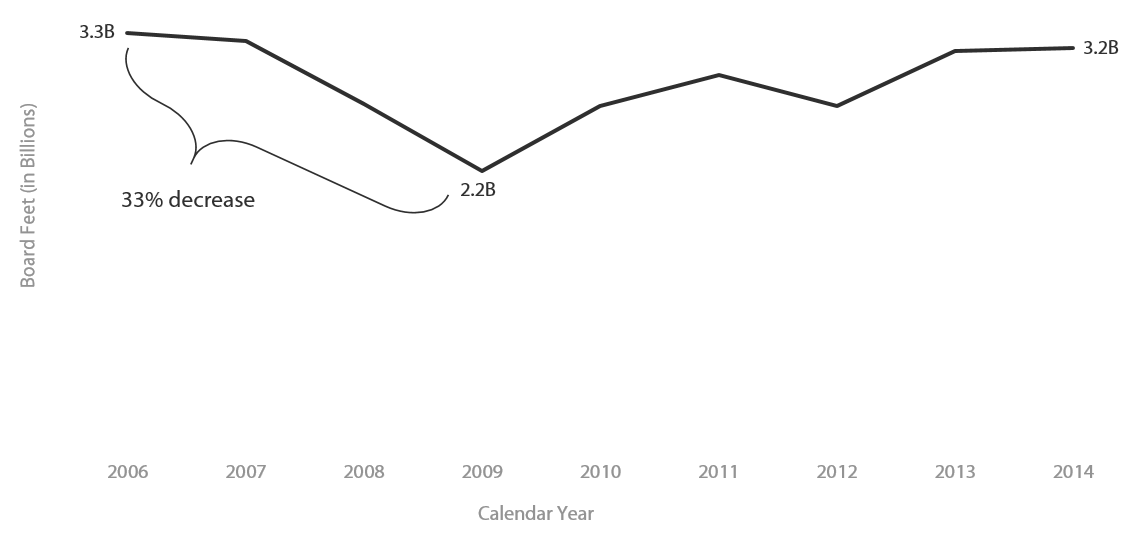
Since GDP detail is not available for logging activities, so JLARC staff estimated a productivity measure by calculating the amount of timber harvested per job in the logging industry for calendar years 2006 to 2013. This may overestimate the productivity measure because the employment numbers may be low. Forestry and logging jobs tend to be understated in Employment Security data because a sizable component of foresters and loggers are self-employed or contractors.
As with timber industry manufacturing activities, the amount of timber harvested per forestry and logging job increased from 2006 to 2013 – in this case, 30 percent.
JLARC staff also analyzed the trends for paper product and wood product jobs and GDP per job nationally and in Washington using the REMI model. The overall trends were similar for periods 2006 through 2013.
REMI Overview
JLARC staff used Regional Economic Models, Inc.’s (REMI) Tax-PI software (v 1.7.105) to model the economic impacts for three tax preference reviews in the 2016 report: trade-ins, timber, and data centers.
REMI software is used by 34 state governments and dozens of private sector consulting firms, research universities, and international clients.
Model Is Tailored to Washington and Includes Government Sector
Tax-PI is an economic impact tool for evaluating the fiscal and economic effects and the demographic impacts of tax policy change. The software includes various features that make it particularly useful for analyzing the economic and fiscal impacts of tax preferences:
- REMI staff consulted with staff from the Office of Financial Management (OFM) and customized a statewide model to reflect Washington’s economy;
- The model contains 160 industry sectors, based on the North American Industry Classification System (NAICS) codes;
- In contrast to other modeling software, Tax-PI includes state and local government as a sector. This permits users to see the trade-offs associated with tax policy changes (e.g., effects on the state’s economy from both increased expenditures by businesses due to a tax preference along with decreased spending by government due to the revenue loss);
- For current revenue and expenditure data, users can input information to reflect their state’s economic and fiscal situation. This allows JLARC staff to calibrate a state budget using up-to-date information from the Economic and Revenue Forecast Council (ERFC) and the Legislative Evaluation and Accountability Program (LEAP); and
- The model can forecast economic and revenue impacts multiple years into the future.
Results the Model Provides
The REMI model accounts for the direct, indirect, and induced effects as they spread through the state’s economy, which allows users to simulate the full impact of tax policy change over time.
- Direct effects are industry specific and capture how a target industry responds to a particular policy change (e.g., changes in industry employment following a change in tax policy);
- Indirect effects capture employment and spending decisions by businesses in the targeted industry’s supply chain that provide goods and services; and
- Induced effects capture the in-state spending and consumption habits of employees in targeted and related industries.
The REMI model produces year-by-year estimates of the total statewide effects of a tax policy change. Impacts are measured as the difference between a baseline economic and revenue forecast and the estimated economic and revenue effects after the policy change.
What the Model Includes
The REMI model is a macroeconomic impact model that incorporates aspects of four major economic modeling approaches: input-output, general equilibrium, econometric, and new economic geography. The foundation of the model, the inter-industry matrices found in the input-output models, captures Washington’s industry structure and the transactions between industries. Layered on top of this structure is a complex set of mathematical equations used to estimate how private industry, consumers, and state and local governments respond to a policy change over time.
- The supply side of the model includes many economic variables representing labor supply, consumer prices, and capital and energy costs with elasticities for both the consumer and business sectors.
- Regional competitiveness is modeled via imports, exports, and output.
- Demographics are modeled using population dynamics (births, deaths, and economic and retirement migration) and includes cohorts for age, sex, race, and retirement.
- Demographic information informs the model’s estimates for economic consumption and labor supply.
- The dynamic aspect comes from the ability to adjust variables over time as forecasted economic conditions change.
While the model is complex and forecasting involves some degree of uncertainty, Tax-PI provides a tool for practitioners to simulate how tax policy and the resulting industry changes affect Washington’s economy, population, and fiscal situation.
This technical appendix provides background detail and supporting information for the JLARC staff analysis of the economic and revenue impacts associated with Washington’s preferential B&O tax rate available to businesses conducting timber industry-related activities. These activities include extracting timber, manufacturing timber products or wood products, and wholesale sales of the same by the manufacturer. The appendix is divided into three sections:
- Section One titled REMI Methodology details how JLARC staff set-up and calibrated the Tax-PI program prior to using the model;
- Section Two titled Jobs and Output for the Timber and Wood Products Industries in REMI tests the robustness of the historical job and output trends summarized in the tab "Are Objectives Being Met?"; and
- Section three titled Modeling the Economic Impact of the Preferential B&O Tax Rate for the Timber and Wood Products Industries in REMI describes the scenario used to estimate the full impact of the B&O preference on the statewide economy and the state’s revenue stream. The results of this analysis are presented in the Revenue and Economic Impacts tab.
1) REMI Methodology
User Inputs in REMI
REMI’s Tax-PI model allows users to model policy changes and analyze the estimated impacts to the Washington economy, both in terms of economic activity and government finances. (See Technical Appendix 2 for an overview of the REMI model.)
Prior to running modeling scenarios, users must make a series of choices about how to set-up the modeling environment by building a state budget and calibrating the model accordingly. JLARC staff used the November 2015 revenue estimates produced by the Economic and Revenue Forecast Council (ERFC) and budgeted expenditures for FY 2014 and 2015, as reported by the Legislative Evaluation and Accountability Program (LEAP) Committee. This data represents the budget and revenue data in the model and serves as the “jump off” point for Tax-PI’s economic and fiscal estimates. Because Tax-PI is a forecasting tool, JLARC staff was unable to model the economic impact of the tax preference beginning in 2006.
In addition to establishing a budget and inputting expected revenue values, users must specify whether government expenditures are determined by demand or revenue. "By demand" imposes a level of government spending in future years that is necessary to maintain the same level-of-service as the final year in which budget data is entered whereas "by revenue" ties government expenditures to estimated changes in revenue collections.
Users may also elect to impose a balanced budget restriction or leave the model unconstrained. The balanced budget feedback forces revenue and expenditures to be equivalent and thus may impose some limitations on economic activity.
By setting expenditures to be determined by demand, users avoid making assumptions about how policymakers may alter spending priorities in the future. In addition, users essentially establish the current budget allocation as carry-forward levels for each expenditure category.
JLARC staff ran the reported scenario with expenditures set to be determined by demand and with the balanced budget feedback option turned on.
Data for the REMI Model
The REMI model comes with historical economic and demographic data back to 1990. The data comes from federal government agencies such as the U.S. Census Bureau, U.S. Energy Information Administration, the Bureau of Labor Statistics, and the Bureau of Economic Analysis. As described above, current revenue and expenditure data for Washington comes from ERFC and LEAP, respectively. The data used to build the modeling scenario described in section three is from JLARC staff estimations of beneficiary savings, based on Department of Revenue (DOR) tax records.
2) Jobs and Output for the Timber and Wood Products Industries in REMI
JLARC staff used REMI’s historical data to test the robustness of the patterns identified for jobs and output in the timber industry. The REMI model uses data from different sources than the JLARC staff analysis in the tab “Are Objectives Being Met?” (For more details, see the note at the end of this section.)
Timber Industry Jobs Declined in Washington Between 2006 and 2014
In terms of timber industry-related jobs in Washington, the REMI model shows a decline similar to what is described in the main report for the years 2006 through 2014. This pattern holds for jobs at both state and national levels.
GDP and GDP per Job for Wood Product and Paper Product Manufacturing in REMI
JLARC staff examined the output and productivity of the timber industry using REMI’s historical data for the same years examined in the main report. We found similar patterns for three of the four GDP trends and three of the four GDP per job trends discussed in the main report.
National GDP
In the REMI model, GDP captures the market value of goods and services produced by labor and property in the United State, regardless of nationality. From 2006 to 2013, the U.S. GDP for all industries increased 12 percent.
REMI captures industry-level GDP for the wood product and paper product manufacturing industries using "value-added." This metric captures the gross output of an industry or sector less its intermediate inputs.
Similar to what is presented in the main report, both the wood product and paper product manufacturing industries showed reductions in GDP from 2006 to 2013.
State GDP
At the state level, Washington also saw a drop in paper product and wood product manufacturing. According to REMI, the Washington GDP for paper product manufacturing decreased 33 percent while the state’s wood product manufacturing GDP decreased 20 percent.
The downturn in GDP for the wood product manufacturing in REMI is significantly different than the 16 percent increase identified in the main report. This difference is likely due to different data sources, which are discussed below.
GDP per Job for Wood Product and Paper Product Manufacturing in REMI
National GDP per Job
At the national level, the REMI analysis finds the same trend of increasing GDP per job for the wood product manufacturing industry. This indicates each job is producing more than it was in 2006. The GDP per job for the paper product manufacturing industry increased by three percent according to the REMI model, but decreased by 10 percent according to the BEA data summarized in the main report. This difference is likely due to different data sources, which are discussed below.
State GDP per Job
In Washington, the GDP per job increased 21 percent for wood product manufacturing but is largely unchanged for paper product manufacturing between 2006 and 2013. These trends are consistent with what is summarized in the main report.
Finally, we did not duplicate the timber harvest and worker productivity analysis because the REMI model does not contain comparable information on board feet of timber harvested.
Notes about Data Sources
Different Approaches in Reporting Employment
The employment and wage numbers used in the main report are from administrative data collected and maintained by the Washington Employment Security Department (ESD) and reported to the U.S. Department of Labor’s Bureau of Labor Statistics (BLS). This data captures workers covered by state unemployment insurance and federal workers covered by unemployment compensation for federal employees. It omits some workers in the labor market, including self-employed and sole proprietors. This is an important distinction as the self-employed make-up a growing segment of the logging industry. Logging is included in the employment trend depicted in the statewide timber employment chart, but not in the GDP and GDP per job charts.
The REMI model, on the other hand, uses employment data from the U.S. Department of Commerce’s Bureau of Economic Analysis (BEA). BEA makes a number of adjustments to employment and wage data for occupations not covered by the BLS system (see BEA’s FAQ for further details).
Understanding the distinction between BEA and BLS employment data is important for two reasons. First, the BEA jobs numbers tend to be higher as they capture a wider selection of employment, including sole proprietors. However, it may count a person holding multiple jobs as a number greater than one, whereas the BLS data counts a person one time regardless of the number of jobs performed. Second, while BEA provides a more comprehensive picture, it has an approximate two-year lag behind BLS data, which is regularly updated throughout the year and receives more attention in the press. According to REMI, BEA employment data operates as a unit of demand related to the tasks a worker performs within a job rather than a job itself.
Different Approaches in Reporting GDP
The GDP numbers reported in the main report are from BEA data. The GDP and value-added numbers in the REMI model come from BLS data. There are three primary reasons why REMI does not use BEA data:
- Industry-level value-added data, by state, is currently available from BEA only for 1997-2012. Historical data in the REMI model goes back to 1990;
- The industry detail from BEA is not sufficient for the REMI model due to the large number of sectors included in the model; and
- BEA uses the same price deflator for every state whereas the REMI model uses a region-specific price deflator.
In reporting “real GDP” and “real GDP per job” using both BEA data and REMI data, we are relying on two different methods to control for inflation. This is due to different options available from our data sources.
To understand the difference between the two approaches, it is important to note that GDP data may be reported either in nominal dollars or real dollars. Nominal GDP reflects the sum of the value of all goods and services produced over a 12 month period. A change in the nominal GDP value from one year to the next may be attributable to changes in prices, changes in the volume of good and services produced, or some combination of these two changes. Real GDP removes the impact of price changes so that GDP captures changes in the volume or quantity of goods and services produced.
There are different ways to adjust GDP to control for inflation:
- A fixed weighting method multiplies the price of each commodity in a fixed base year (e.g., 2009) by the quantity produced in each individual year (e.g., 2006 through 2013) to calculate its contribution to overall GDP.
- A chained weighting method adjusts the relative price weights in each year rather than comparing prices to those in a fixed base year. This is done because over time, relative changes in prices and resulting changes in purchases can distort the measure of output under a fixed-year weighting method.
The GDP data from BEA in the full report uses chained weighting whereas the REMI output reported above relies on the fixed weighting method.
3) Modeling the Economic Impact of the Preferential B&O Tax Rate for the Timber and Wood Products Industry Using REMI
JLARC staff modeled the impact of the timber and wood products industry B&O preferences on three outcomes: jobs, wages, and state revenue. Economic and fiscal activity are estimated through the expiration date of the preference in Calendar Year 2024.
Modeling Assumptions: How JLARC Staff Built the REMI Scenario
JLARC staff followed a two-step approach to modeling the economic and fiscal impacts of the timber and wood products B&O preferences:
- Reduced production costs for six distinct timber and wood products manufacturing sectors included in the REMI model, and
- Reduced government spending by an amount equivalent to the taxpayer savings.
| NAICS | Industry Description |
|---|---|
| 1133 | Logging |
| 3211 | Sawmills and wood preservation |
| 3212 | Veneer, plywood, and engineered wood product manufacturing |
| 3219 | Other wood product manufacturing |
| 3221 | Pulp, paper, and paperboard mills |
| 3222 | Converted paper product manufacturing |
These six industries are the same industries examined earlier in Section Two of this Technical Appendix and in Technical Appendix 1.
JLARC staff used production costs to model the tax preference. In the model, this variable affects the cost of doing business without directly changing the relative costs of inputs (labor, capital, and fuel). JLARC staff allocated all of the savings to the production costs for the timber and wood products manufacturing industries. Adjusting production costs in this manner assumes that savings from the tax preference are funneled back into the primary business activity. This assumption provides an upper bound estimate for economic activity related to the tax treatment as it concentrates the benefit of the tax preference in production-related activities in Washington. In REMI, reductions in production costs increase in-state business activity.
JLARC staff calculated estimated beneficiary savings based on DOR tax return data and used these values to reduce each industry’s production costs. The beneficiary savings were shared across the timber and wood products industries in proportion to each industry’s projected output, as estimated in REMI. In Tax-PI, output is defined as “the amount of production, including all intermediate goods purchased as well as value added (compensation and profit).” This can also be thought of as the total of self-supply and all exports (multiregions, rest of nation, and rest of world).
We also reduced government spending by an amount equivalent to the reduction in production costs for each year in the analysis. The reduction of production costs and government spending, by the same amount is a method for estimating the total economic and fiscal impact of a change in tax policy.
Reporting the Results: What is Included in Employee Earnings
The REMI model includes multiple compensation and earnings variables, all of which show a similar pattern. In the main report we show earnings by place of work because an increasing number of people working in the logging industry are self-employed or sole proprietors. This indicator captures the "sum of wages and salaries, supplements to wages and salaries, and proprietors’ income."
RCW 82.04.260
Tax on manufacturers and processors of various foods and by-products—Research and development organizations—Travel agents—Certain international activities—Stevedoring and associated activities—Low-level waste disposers—Insurance producers, surplus line brokers, and title insurance agents—Hospitals—Commercial airplane activities—Timber product activities—Canned salmon processors.
(1) Upon every person engaging within this state in the business of manufacturing:
(a) Wheat into flour, barley into pearl barley, soybeans into soybean oil, canola into canola oil, canola meal, or canola by-products, or sunflower seeds into sunflower oil; as to such persons the amount of tax with respect to such business is equal to the value of the flour, pearl barley, oil, canola meal, or canola by-product manufactured, multiplied by the rate of 0.138 percent;
(b) Beginning July 1, 2025, seafood products that remain in a raw, raw frozen, or raw salted state at the completion of the manufacturing by that person; or selling manufactured seafood products that remain in a raw, raw frozen, or raw salted state at the completion of the manufacturing, to purchasers who transport in the ordinary course of business the goods out of this state; as to such persons the amount of tax with respect to such business is equal to the value of the products manufactured or the gross proceeds derived from such sales, multiplied by the rate of 0.138 percent. Sellers must keep and preserve records for the period required by RCW 82.32.070 establishing that the goods were transported by the purchaser in the ordinary course of business out of this state;
(c)(i) Beginning July 1, 2025, dairy products; or selling dairy products that the person has manufactured to purchasers who either transport in the ordinary course of business the goods out of state or purchasers who use such dairy products as an ingredient or component in the manufacturing of a dairy product; as to such persons the tax imposed is equal to the value of the products manufactured or the gross proceeds derived from such sales multiplied by the rate of 0.138 percent. Sellers must keep and preserve records for the period required by RCW 82.32.070 establishing that the goods were transported by the purchaser in the ordinary course of business out of this state or sold to a manufacturer for use as an ingredient or component in the manufacturing of a dairy product.
(ii) For the purposes of this subsection (1)(c), "dairy products" means:
(A) Products, not including any marijuana-infused product, that as of September 20, 2001, are identified in 21 C.F.R., chapter 1, parts 131, 133, and 135, including by-products from the manufacturing of the dairy products, such as whey and casein; and
(B) Products comprised of not less than seventy percent dairy products that qualify under (c)(ii)(A) of this subsection, measured by weight or volume.
(iii) The preferential tax rate provided to taxpayers under this subsection (1)(c) does not apply to sales of dairy products on or after July 1, 2023, where a dairy product is used by the purchaser as an ingredient or component in the manufacturing in Washington of a dairy product;
(d)(i) Beginning July 1, 2025, fruits or vegetables by canning, preserving, freezing, processing, or dehydrating fresh fruits or vegetables, or selling at wholesale fruits or vegetables manufactured by the seller by canning, preserving, freezing, processing, or dehydrating fresh fruits or vegetables and sold to purchasers who transport in the ordinary course of business the goods out of this state; as to such persons the amount of tax with respect to such business is equal to the value of the products manufactured or the gross proceeds derived from such sales multiplied by the rate of 0.138 percent. Sellers must keep and preserve records for the period required by RCW 82.32.070 establishing that the goods were transported by the purchaser in the ordinary course of business out of this state.
(ii) For purposes of this subsection (1)(d), "fruits" and "vegetables" do not include marijuana, useable marijuana, or marijuana-infused products;
(e) Until July 1, 2009, alcohol fuel, biodiesel fuel, or biodiesel feedstock, as those terms are defined in RCW 82.29A.135; as to such persons the amount of tax with respect to the business is equal to the value of alcohol fuel, biodiesel fuel, or biodiesel feedstock manufactured, multiplied by the rate of 0.138 percent; and
(f) Wood biomass fuel as defined in RCW 82.29A.135; as to such persons the amount of tax with respect to the business is equal to the value of wood biomass fuel manufactured, multiplied by the rate of 0.138 percent.
(2) Upon every person engaging within this state in the business of splitting or processing dried peas; as to such persons the amount of tax with respect to such business is equal to the value of the peas split or processed, multiplied by the rate of 0.138 percent.
(3) Upon every nonprofit corporation and nonprofit association engaging within this state in research and development, as to such corporations and associations, the amount of tax with respect to such activities is equal to the gross income derived from such activities multiplied by the rate of 0.484 percent.
(4) Upon every person engaging within this state in the business of slaughtering, breaking and/or processing perishable meat products and/or selling the same at wholesale only and not at retail; as to such persons the tax imposed is equal to the gross proceeds derived from such sales multiplied by the rate of 0.138 percent.
(5) Upon every person engaging within this state in the business of acting as a travel agent or tour operator; as to such persons the amount of the tax with respect to such activities is equal to the gross income derived from such activities multiplied by the rate of 0.275 percent.
(6) Upon every person engaging within this state in business as an international steamship agent, international customs house broker, international freight forwarder, vessel and/or cargo charter broker in foreign commerce, and/or international air cargo agent; as to such persons the amount of the tax with respect to only international activities is equal to the gross income derived from such activities multiplied by the rate of 0.275 percent.
(7) Upon every person engaging within this state in the business of stevedoring and associated activities pertinent to the movement of goods and commodities in waterborne interstate or foreign commerce; as to such persons the amount of tax with respect to such business is equal to the gross proceeds derived from such activities multiplied by the rate of 0.275 percent. Persons subject to taxation under this subsection are exempt from payment of taxes imposed by chapter 82.16 RCW for that portion of their business subject to taxation under this subsection. Stevedoring and associated activities pertinent to the conduct of goods and commodities in waterborne interstate or foreign commerce are defined as all activities of a labor, service or transportation nature whereby cargo may be loaded or unloaded to or from vessels or barges, passing over, onto or under a wharf, pier, or similar structure; cargo may be moved to a warehouse or similar holding or storage yard or area to await further movement in import or export or may move to a consolidation freight station and be stuffed, unstuffed, containerized, separated or otherwise segregated or aggregated for delivery or loaded on any mode of transportation for delivery to its consignee. Specific activities included in this definition are: Wharfage, handling, loading, unloading, moving of cargo to a convenient place of delivery to the consignee or a convenient place for further movement to export mode; documentation services in connection with the receipt, delivery, checking, care, custody and control of cargo required in the transfer of cargo; imported automobile handling prior to delivery to consignee; terminal stevedoring and incidental vessel services, including but not limited to plugging and unplugging refrigerator service to containers, trailers, and other refrigerated cargo receptacles, and securing ship hatch covers.
(8) Upon every person engaging within this state in the business of disposing of low-level waste, as defined in RCW 43.145.010; as to such persons the amount of the tax with respect to such business is equal to the gross income of the business, excluding any fees imposed under chapter 43.200 RCW, multiplied by the rate of 3.3 percent.
If the gross income of the taxpayer is attributable to activities both within and without this state, the gross income attributable to this state must be determined in accordance with the methods of apportionment required under RCW 82.04.460.
(9) Upon every person engaging within this state as an insurance producer or title insurance agent licensed under chapter 48.17 RCW or a surplus line broker licensed under chapter 48.15 RCW; as to such persons, the amount of the tax with respect to such licensed activities is equal to the gross income of such business multiplied by the rate of 0.484 percent.
(10) Upon every person engaging within this state in business as a hospital, as defined in chapter 70.41 RCW, that is operated as a nonprofit corporation or by the state or any of its political subdivisions, as to such persons, the amount of tax with respect to such activities is equal to the gross income of the business multiplied by the rate of 0.75 percent through June 30, 1995, and 1.5 percent thereafter.
(11)(a) Beginning October 1, 2005, upon every person engaging within this state in the business of manufacturing commercial airplanes, or components of such airplanes, or making sales, at retail or wholesale, of commercial airplanes or components of such airplanes, manufactured by the seller, as to such persons the amount of tax with respect to such business is, in the case of manufacturers, equal to the value of the product manufactured and the gross proceeds of sales of the product manufactured, or in the case of processors for hire, equal to the gross income of the business, multiplied by the rate of:
(i) 0.4235 percent from October 1, 2005, through June 30, 2007; and
(ii) 0.2904 percent beginning July 1, 2007.
(b) Beginning July 1, 2008, upon every person who is not eligible to report under the provisions of (a) of this subsection (11) and is engaging within this state in the business of manufacturing tooling specifically designed for use in manufacturing commercial airplanes or components of such airplanes, or making sales, at retail or wholesale, of such tooling manufactured by the seller, as to such persons the amount of tax with respect to such business is, in the case of manufacturers, equal to the value of the product manufactured and the gross proceeds of sales of the product manufactured, or in the case of processors for hire, be equal to the gross income of the business, multiplied by the rate of 0.2904 percent.
(c) For the purposes of this subsection (11), "commercial airplane" and "component" have the same meanings as provided in RCW 82.32.550.
(d) In addition to all other requirements under this title, a person reporting under the tax rate provided in this subsection (11) must file a complete annual report with the department under RCW 82.32.534.
(e)(i) Except as provided in (e)(ii) of this subsection (11), this subsection (11) does not apply on and after July 1, 2040.
(ii) With respect to the manufacturing of commercial airplanes or making sales, at retail or wholesale, of commercial airplanes, this subsection (11) does not apply on and after July 1st of the year in which the department makes a determination that any final assembly or wing assembly of any version or variant of a commercial airplane that is the basis of a siting of a significant commercial airplane manufacturing program in the state under RCW 82.32.850 has been sited outside the state of Washington. This subsection (11)(e)(ii) only applies to the manufacturing or sale of commercial airplanes that are the basis of a siting of a significant commercial airplane manufacturing program in the state under RCW 82.32.850.
(12)(a) Until July 1, 2024, upon every person engaging within this state in the business of extracting timber or extracting for hire timber; as to such persons the amount of tax with respect to the business is, in the case of extractors, equal to the value of products, including by-products, extracted, or in the case of extractors for hire, equal to the gross income of the business, multiplied by the rate of 0.4235 percent from July 1, 2006, through June 30, 2007, and 0.2904 percent from July 1, 2007, through June 30, 2024.
(b) Until July 1, 2024, upon every person engaging within this state in the business of manufacturing or processing for hire: (i) Timber into timber products or wood products; or (ii) timber products into other timber products or wood products; as to such persons the amount of the tax with respect to the business is, in the case of manufacturers, equal to the value of products, including by-products, manufactured, or in the case of processors for hire, equal to the gross income of the business, multiplied by the rate of 0.4235 percent from July 1, 2006, through June 30, 2007, and 0.2904 percent from July 1, 2007, through June 30, 2024.
(c) Until July 1, 2024, upon every person engaging within this state in the business of selling at wholesale: (i) Timber extracted by that person; (ii) timber products manufactured by that person from timber or other timber products; or (iii) wood products manufactured by that person from timber or timber products; as to such persons the amount of the tax with respect to the business is equal to the gross proceeds of sales of the timber, timber products, or wood products multiplied by the rate of 0.4235 percent from July 1, 2006, through June 30, 2007, and 0.2904 percent from July 1, 2007, through June 30, 2024.
(d) Until July 1, 2024, upon every person engaging within this state in the business of selling standing timber; as to such persons the amount of the tax with respect to the business is equal to the gross income of the business multiplied by the rate of 0.2904 percent. For purposes of this subsection (12)(d), "selling standing timber" means the sale of timber apart from the land, where the buyer is required to sever the timber within thirty months from the date of the original contract, regardless of the method of payment for the timber and whether title to the timber transfers before, upon, or after severance.
(e) For purposes of this subsection, the following definitions apply:
(i) "Biocomposite surface products" means surface material products containing, by weight or volume, more than fifty percent recycled paper and that also use nonpetroleum-based phenolic resin as a bonding agent.
(ii) "Paper and paper products" means products made of interwoven cellulosic fibers held together largely by hydrogen bonding. "Paper and paper products" includes newsprint; office, printing, fine, and pressure-sensitive papers; paper napkins, towels, and toilet tissue; kraft bag, construction, and other kraft industrial papers; paperboard, liquid packaging containers, containerboard, corrugated, and solid-fiber containers including linerboard and corrugated medium; and related types of cellulosic products containing primarily, by weight or volume, cellulosic materials. "Paper and paper products" does not include books, newspapers, magazines, periodicals, and other printed publications, advertising materials, calendars, and similar types of printed materials.
(iii) "Recycled paper" means paper and paper products having fifty percent or more of their fiber content that comes from postconsumer waste. For purposes of this subsection (12)(e)(iii), "postconsumer waste" means a finished material that would normally be disposed of as solid waste, having completed its life cycle as a consumer item.
(iv) "Timber" means forest trees, standing or down, on privately or publicly owned land. "Timber" does not include Christmas trees that are cultivated by agricultural methods or short-rotation hardwoods as defined in RCW 84.33.035.
(v) "Timber products" means:
(A) Logs, wood chips, sawdust, wood waste, and similar products obtained wholly from the processing of timber, short-rotation hardwoods as defined in RCW 84.33.035, or both;
(B) Pulp, including market pulp and pulp derived from recovered paper or paper products; and
(C) Recycled paper, but only when used in the manufacture of biocomposite surface products.
(vi) "Wood products" means paper and paper products; dimensional lumber; engineered wood products such as particleboard, oriented strand board, medium density fiberboard, and plywood; wood doors; wood windows; and biocomposite surface products.
(f) Except for small harvesters as defined in RCW 84.33.035, a person reporting under the tax rate provided in this subsection (12) must file a complete annual survey with the department under RCW 82.32.585.
(13) Upon every person engaging within this state in inspecting, testing, labeling, and storing canned salmon owned by another person, as to such persons, the amount of tax with respect to such activities is equal to the gross income derived from such activities multiplied by the rate of 0.484 percent.
(14)(a) Upon every person engaging within this state in the business of printing a newspaper, publishing a newspaper, or both, the amount of tax on such business is equal to the gross income of the business multiplied by the rate of 0.35 percent until July 1, 2024, and 0.484 percent thereafter.
(b) A person reporting under the tax rate provided in this subsection (14) must file a complete annual report with the department under RCW 82.32.534.
[2015 3rd sp.s. c 6 § 602; 2015 3rd sp.s. c 6 § 205. Prior: 2014 c 140 § 6; (2014 c 140 § 5 expired July 1, 2015); 2014 c 140 § 4; (2014 c 140 § 3 expired July 1, 2015); 2013 3rd sp.s. c 2 § 6; (2013 3rd sp.s. c 2 § 5 expired July 1, 2015); 2013 2nd sp.s. c 13 § 203; (2013 2nd sp.s. c 13 § 202 expired July 1, 2015); prior: (2012 2nd sp.s. c 6 § 602 expired July 1, 2015); 2012 2nd sp.s. c 6 § 204; 2011 c 2 § 203 (Initiative Measure No. 1107, approved November 2, 2010); 2010 1st sp.s. c 23 § 506; (2010 1st sp.s. c 23 § 505 expired June 10, 2010); 2010 c 114 § 107; prior: 2009 c 479 § 64; 2009 c 461 § 1; 2009 c 162 § 34; prior: 2008 c 296 § 1; 2008 c 217 § 100; 2008 c 81 § 4; prior: 2007 c 54 § 6; 2007 c 48 § 2; prior: 2006 c 354 § 4; 2006 c 300 § 1; prior: 2005 c 513 § 2; 2005 c 443 § 4; prior: 2003 2nd sp.s. c 1 § 4; 2003 2nd sp.s. c 1 § 3; 2003 c 339 § 11; 2003 c 261 § 11; 2001 2nd sp.s. c 25 § 2; prior: 1998 c 312 § 5; 1998 c 311 § 2; prior: 1998 c 170 § 4; 1996 c 148 § 2; 1996 c 115 § 1; prior: 1995 2nd sp.s. c 12 § 1; 1995 2nd sp.s. c 6 § 1; 1993 sp.s. c 25 § 104; 1993 c 492 § 304; 1991 c 272 § 15; 1990 c 21 § 2; 1987 c 139 § 1; prior: 1985 c 471 § 1; 1985 c 135 § 2; 1983 2nd ex.s. c 3 § 5; prior: 1983 1st ex.s. c 66 § 4; 1983 1st ex.s. c 55 § 4; 1982 2nd ex.s. c 13 § 1; 1982 c 10 § 16; prior: 1981 c 178 § 1; 1981 c 172 § 3; 1979 ex.s. c 196 § 2; 1975 1st ex.s. c 291 § 7; 1971 ex.s. c 281 § 5; 1971 ex.s. c 186 § 3; 1969 ex.s. c 262 § 36; 1967 ex.s. c 149 § 10; 1965 ex.s. c 173 § 6; 1961 c 15 § 82.04.260; prior: 1959 c 211 § 2; 1955 c 389 § 46; prior: 1953 c 91 § 4; 1951 2nd ex.s. c 28 § 4; 1950 ex.s. c 5 § 1, part; 1949 c 228 § 1, part; 1943 c 156 § 1, part; 1941 c 178 § 1, part; 1939 c 225 § 1, part; 1937 c 227 § 1, part; 1935 c 180 § 4, part; Rem. Supp. 1949 § 8370-4, part.]
NOTES:
Reviser's note: This section was amended by 2015 3rd sp.s. c 6 § 205 and by 2015 3rd sp.s. c 6 § 602, each without reference to the other. Both amendments are incorporated in the publication of this section under RCW 1.12.025(2). For rule of construction, see RCW 1.12.025(1).
Expiration date—2015 3rd sp.s. c 6; 2012 2nd sp.s. c 6 § 602: "Section 602 of this act expires July 1, 2015." [2015 3rd sp.s. c 6 § 603; 2012 2nd sp.s. c 6 § 704.]
RCW 82.45.195
Exemptions—Standing timber sales.
A sale of standing timber is exempt from tax under this chapter if the gross income from such sale is taxable under RCW 82.04.260(12)(d).
[ 2014 c 97 § 308; 2010 1st sp.s. c 23 § 518; 2007 c 48 § 7.]
NOTES:
Reviser's note: This section was amended by 2015 3rd sp.s. c 6 § 205 and by 2015 3rd sp.s. c 6 § 602, each without reference to the other. Both amendments are incorporated in the publication of this section under RCW 1.12.025(2). For rule of construction, see RCW 1.12.025(1).
Expiration date—2015 3rd sp.s. c 6; 2012 2nd sp.s. c 6 § 602: "Section 602 of this act expires July 1, 2015." [2015 3rd sp.s. c 6 § 603; 2012 2nd sp.s. c 6 § 704.]
- Legislative Auditor Recommendation
- Letter from Commission Chair
- Commissioners’ Recommendation
- Agency Response
Timber and Wood Products Reduced B&O Rate
The Legislature should review and clarify the timber and wood products preferential B&O rate because while it is reducing the cost of business, it is unclear how it is impacting employment and competitiveness. As part of the clarification, the Legislature should provide a performance statement identifying the public policy objectives and providing targets and metrics to measure whether the objectives have been achieved.
- The preference is meeting the inferred objective of reducing the cost of doing business in Washington for the timber industry by providing a lower B&O tax rate.
- Results for the inferred objective of retaining good jobs in rural areas are mixed:
- The overall number of timber industry jobs in Washington has declined since the preference was enacted in 2006, but the decline has been less in rural counties than in nonrural counties;
- For the timber industry jobs that remain in rural counties, wages are higher than the average wage for those counties;
- Output per worker has increased.
- It is unclear if the preference has had any impact on Washington’s ability to compete nationally in the timber industry. For the period 2001 to 2014, Washington’s location quotient remained unchanged for wood product manufacturing. The state’s location quotient declined for both paper product manufacturing and for forestry and logging jobs.
- The B&O preference is scheduled to expire in 2024. JLARC staff will likely review the preference again prior to that date. The Legislature has yet to state public policy objectives for either preference. Providing a tax preference performance statement that identifies the objectives along with any targets and metrics would facilitate future review.
The Legislative Auditor’s 2014 guidance document for drafting performance statements provides information on what detail to include.
Legislation Required: Yes.
Fiscal Impact: Depends on legislative action.
Standing Timber REET Exemption
The Legislature should continue the real estate excise tax exemption for standing timber sales because it is achieving the inferred objective of helping Washington’s wood products and timber businesses adjust to structural changes in the industry.
Legislation Required: No.
Fiscal Impact: None.


Timber and Wood Products Reduced B&O Rate
The Commission endorses the Legislative Auditor’s recommendation.
The preference for timber and wood products may be helping offset environmental costs not borne by foreign competitors. The Legislature should review and clarify the preference, to provide a more measurable performance statement. As it undergoes this review, the Legislature should also measure the tax burden of this extractive and manufacturing industry and consider whether there is a disproportionate burden of B&O tax that is not faced by other industries or its competitors in other taxing jurisdictions.
Standing Timber REET Exemption
The Commission endorses the Legislative Auditor’s recommendation without comment.
Joint Department of Revenue and Office of Financial Management Response