This technical appendix provides background detail and supporting information for the
JLARC staff analysis of the employment impacts associated with Washington's sales and
use tax deferral for investment projects in high unemployment counties and CEZs. The
appendix is divided into three sections:
- Section One titled REMI Methodology details how JLARC staff set up and
calibrated the Tax-PI program prior to using the model.
- Section Two titled Jobs for the Manufacturing Industries in REMI discusses
baseline manufacturing employment in the REMI model of the Washington economy, and
the observed increase in employment at business sites where beneficiaries have used
the preference.
- Section Three titled Modeling the Impact of the Sales and Use Tax Deferral for
the Manufacturing Industry in REMI describes the scenarios used to estimate
the range of potential employment effects of the sales and use tax deferral on
statewide employment. The results of this analysis are presented in the "Are
Objectives Being Met?" tab.
1) REMI Methodology
User Inputs in REMI
REMI's Tax-PI model allows users to model policy changes and analyze the estimated
impacts to the Washington economy, both in terms of economic activity and government
finances. (See Technical Appendix 1 for an overview of the REMI model.)
Prior to running modeling scenarios, users must make a series of choices about how to
set up the modeling environment by building a state budget and calibrating the model
accordingly. JLARC staff used the November 2017 revenue estimates produced by the
Economic and Revenue Forecast Council (ERFC) and budgeted expenditures for fiscal
years 2016 and 2017, as reported by the Legislative Evaluation and Accountability
Program (LEAP) Committee. This data represents the budget and revenue data in the
model and serves as the "jump off" point for Tax-PI's economic and fiscal estimates.
Because Tax-PI is a forecasting tool, JLARC staff was unable to model the economic
impact of the tax preference beginning in 2010.
In addition to establishing a budget and inputting expected revenue values, users
must specify whether government expenditures are determined by demand or revenue. "By
demand" imposes a level of government spending in future years that is necessary to
maintain the same level of service as the final year in which budget data is entered.
"By revenue" ties government expenditures to estimated changes in revenue collections.
Users may also elect to impose a balanced budget restriction or leave the model
unconstrained. The balanced budget feedback forces revenue and expenditures to be
equivalent and thus may impose some limitations on economic activity.
By setting expenditures to be determined by demand, users avoid making assumptions
about how policymakers may alter spending priorities in the future. In addition, users
essentially establish the current budget allocation as carry-forward levels for each
expenditure category.
JLARC staff ran the reported scenarios with expenditures set to be determined by
demand and with the balanced budget feedback option turned on.
Data for the REMI Model
The REMI model comes with historical economic and demographic data back to 1990. The
data comes from federal government agencies such as the U.S. Census Bureau, U.S.
Energy Information Administration, the Bureau of Labor Statistics, and the Bureau of
Economic Analysis. As described above, current revenue and expenditure data for
Washington comes from ERFC and LEAP, respectively. The data to build the modeling
scenario described in section three is from JLARC staff estimations of beneficiary
savings, based on Department of Revenue tax records.
2) Jobs for the Manufacturing Industries in REMI
The majority of businesses that claim the deferral report North American Industry
Classification System (NAICS) numbers identifying them as primarily manufacturing
businesses. Therefore, JLARC staff modeled the potential employment effects of the
preference on baseline employment of businesses in the manufacturing industry (NAICS
31 - 33).
Manufacturing Industry Jobs Fluctuated in Washington between 2001 and 2015
REMI's historical baseline forecast employment data for the manufacturing industry
fluctuated from a high of 331,000 in 2001 to a low of 275,000 in 2010. Employment is
projected to decline steadily from 312,000 in 2015 to 289,000 in 2030.
Exhibit: REMI Baseline and Forecast Data Shows Statewide Manufacturing Jobs Decline
after 2015
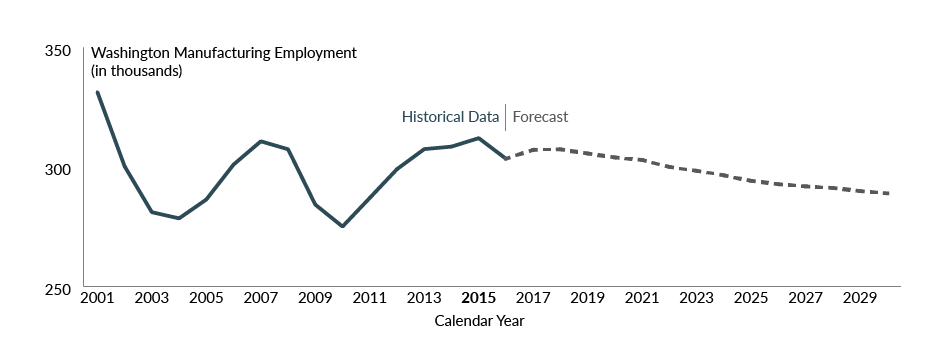
Source: JLARC staff analysis of REMI data for jobs using NAICS codes for
manufacturing (31 - 33).
Beneficiaries of the Tax Preference Report 131 New Jobs at Qualifying Sites
Data reported to the Department of Revenue shows the 44 businesses that claimed the
preference in 2016 increased employment by 131 during 2010-2016, the years the tax
preference has been in effect.
3) Modeling the Impact of the Sales and Use Tax Deferral for Investment Projects in
High Unemployment Counties and CEZs
JLARC staff followed a two-step approach to modeling the employment impacts of the
tax preference:
- Increased employment in all manufacturing sectors included in the REMI model.
- Reduced government spending by an amount equivalent to the taxpayer savings.
JLARC staff modeled three scenarios that illustrate the range of potential employment
effects that result from the tax preference. JLARC staff are unable to determine how
many of the 131 jobs created at the manufacturing sites of beneficiary businesses were
created directly as a result of the preference. Instead, JLARC staff attempted to
illustrate lower and upper bounds of potential employment effects based on two
assumptions for the share of reported jobs that were directly created as a result of
the preference, as well as the point at which the positive employment effects of
additional manufacturing employment offset the negative employment effects of reduced
government spending.
For each scenario modeled, JLARC staff modeled a change in nominal state government
spending in the amount of the estimated beneficiary savings for FY 2016-2030.These
amounts are shown below:
|
Fiscal Year
|
Estimated Beneficiary Savings
|
|
2016
|
1,203,669
|
|
2017
|
1,631,488
|
|
2018
|
2,046,273
|
|
2019
|
2,461,059
|
|
2020
|
2,875,844
|
|
2021
|
2,875,844
|
|
2022
|
2,876,000
|
|
2023
|
2,876,000
|
|
2024
|
2,876,000
|
|
2025
|
2,876,000
|
|
2026
|
2,461,000
|
|
2027
|
2,046,000
|
|
2028
|
1,632,000
|
|
2029
|
1,217,000
|
|
2030
|
802,000
|
Scenario 1: Beneficiary Savings Induce No Change in Manufacturing Sector
In the first scenario, JLARC staff assumed none of the 131 new jobs were
created directly due to the preference. This scenario assumes no manufacturing
employment change from the baseline, and includes only the direct, indirect, and
induced employment effects of the change in state government spending.
Scenario 2: Beneficiary Savings Induce Reported Job Increases at Manufacturing
Sites
In the second scenario, JLARC staff assumed all of the 131 new jobs were
created directly due to the preference. This scenario assumes the manufacturing
employment change from the baseline of 131 jobs, distributed among the 75
manufacturing subsectors in the REMI model, weighted by each subsector's relative
output level. The employment changes are applied at the firm (competes locally) level.
Scenario 3: Beneficiary Savings Induce Some Job Increases at Manufacturing Sites, No
Net Employment Change in 2016
In the third scenario, JLARC staff assumed just enough of the 131 new jobs
were created directly due to the preference to offset the employment losses resulting
from the reduction in government spending. This scenario involved running REMI
scenarios with incrementally increasing manufacturing employment changes until the
2016 employment change from the baseline was zero. In each case, the manufacturing
employment change from the baseline was distributed among the 75 manufacturing
subsectors in the REMI model, weighted by each subsector's relative output level. The
employment changes are applied at the firm (competes locally) level.
JLARC staff used REMI to model how this direct employment change and its indirect and
induced effects offset the direct, indirect, and induced employment effects of the
change in state government spending.
Exhibit: Three Scenarios Illustrate Range of Possible Statewide Employment Effects
of Tax Preference
|
Scenario #
|
Description
|
2016
|
2017
|
2018
|
2019
|
2020
|
2021
|
|
1
|
Beneficiary Savings Induce No Change in Manufacturing Sector
|
-29
|
-40
|
-51
|
-59
|
-65
|
-62
|
|
2
|
Beneficiary Savings Induce Reported Job Increases at Manufacturing Sites
|
429
|
455
|
539
|
532
|
516
|
503
|
|
3
|
Beneficiary Savings Induce Some Job Increases at Manufacturing Sites, No Net
Employment Change in 2016
|
0
|
-8
|
-12
|
-20
|
-28
|
-26
|
Source: JLARC staff analysis on future year possible employment changes using REMI
economic modeling tool.
Two Employment Data Sources
Different Approaches in Reporting Employment
The employment and wage numbers used in the main report are from administrative data
collected and maintained by the Washington Employment Security Department (ESD) and
reported to the U.S. Department of Labor's Bureau of Labor Statistics (BLS). This data
captures workers covered by state unemployment insurance and federal workers covered
by unemployment compensation for federal employees. It omits some workers in the labor
market, including self-employed and sole proprietors.
The REMI model, on the other hand, uses employment data from the U.S. Department of
Commerce's Bureau of Economic Analysis (BEA). BEA makes a number of adjustments to
employment and wage data for occupations not covered by the BLS system (see BEA's Frequently Asked
Questions for further details).
Understanding the distinction between BEA and BLS employment data is important for
two reasons. First, the BEA jobs numbers tend to be higher, as they capture a wider
selection of employment, including sole proprietors. However, it may count a person
holding multiple jobs as a number greater than one, whereas the BLS data counts a
person one time regardless of the number of jobs performed. Second, while BEA provides
a more comprehensive picture, it has an approximate two-year lag behind BLS data,
which is regularly updated throughout the year and receives more attention in the
press. According to REMI, BEA employment data operates as a unit of demand related to
the tasks a worker performs within a job, rather than a job itself.
❮ Previous
Next ❯


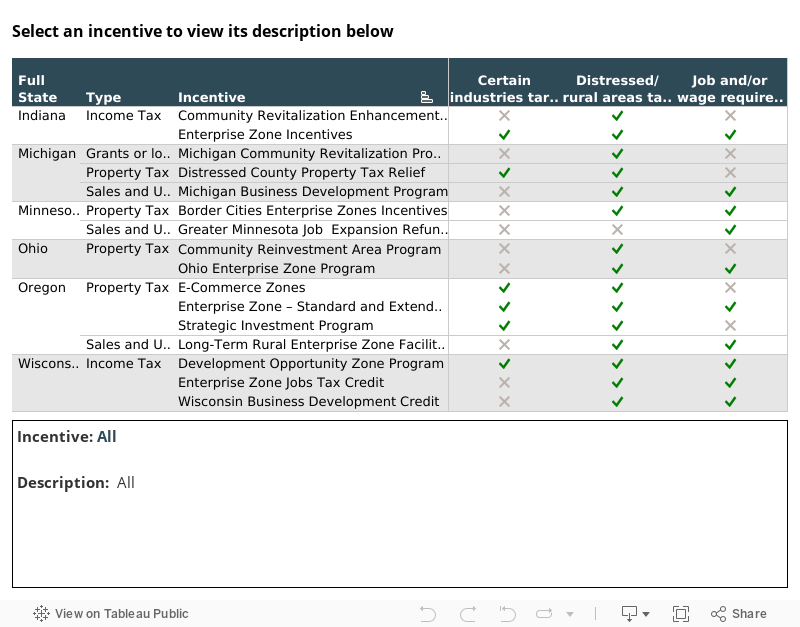
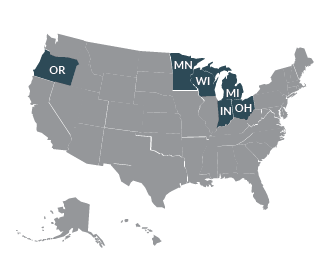 JLARC staff reviewed economic development tax incentive programs offered in top
manufacturing states as well as Idaho and Oregon, two neighboring states. Staff
focused on leading manufacturing states because the majority of beneficiaries of this
preference are manufacturers. In 2016, the five states with the greatest concentration
of manufacturing jobs were Michigan, Wisconsin, Ohio, Indiana, and Minnesota.
JLARC staff reviewed economic development tax incentive programs offered in top
manufacturing states as well as Idaho and Oregon, two neighboring states. Staff
focused on leading manufacturing states because the majority of beneficiaries of this
preference are manufacturers. In 2016, the five states with the greatest concentration
of manufacturing jobs were Michigan, Wisconsin, Ohio, Indiana, and Minnesota.