
An updated version of this report is available.

Cannabis Market Study
PRELIMINARY REPORT | MAY 2025
Suzanna Pratt, Andrew Hatt, research
analysts
Ryan McCord, audit director; Eric Thomas, legislative auditor
Legislative Auditor's conclusion
Washington businesses produced two to three times more cannabis than retailers sold in 2023. Inaccurate and incomplete data limits the Liquor and Cannabis Board's capacity for data-driven regulation.
Key points
- The Liquor and Cannabis Board (LCB) regulates Washington's cannabis industry.
- LCB regulates production by limiting growing space. It does not have an accurate measure of the amount of cannabis produced.
- JLARC's consultant, RAND, estimated broad ranges for cannabis produced, sold, and consumed in 2023 due to data limitations.
- These data limitations prevent LCB from answering the Legislature's questions about supply and demand and restrict its capacity for data-driven regulation.
- An existing oversupply of cannabis and 31.6% decline in producers since 2017 indicate challenging market conditions for producers that will be licensed through the Social Equity in Cannabis Program.
Executive summary
Washington voters legalized recreational cannabis in 2012 with the approval of Initiative 502. It charged LCB with:
- Establishing regulations.
- Issuing licenses to cannabis businesses.
- Collecting a tax on retail sales.
LCB regulates cannabis businesses
Cannabis is cultivated for tetrahydrocannabinol (THC), a compound with psychoactive effects. THC is concentrated in the plant's flowers.
LCB issues three main types of cannabis licenses: producers, processors, and retailers.
LCB regulates cannabis production by limiting the amount of growing space (called canopy) that a producer may have. In 2023, cannabis producers had an estimated 12.2 million square feet of canopy.
Limiting canopy is a common regulatory approach among states with legal recreational cannabis. It is not a measure of the output from cannabis producers. LCB does not currently have reliable data that it can use to quantify the amount of cannabis produced by licensed producers. In addition, LCB's lack of production data meant that the Joint Legislative Audit and Review Committee's (JLARC) consultant, RAND, had to rely on other data and assumptions about production for its estimates of cannabis production.
Production is likely two to three times higher than sales
The 2023 Legislature directed JLARC staff to review whether cannabis production aligns with market demand and capacity. JLARC staff contracted with the RAND Corporation (RAND) to conduct this work. RAND performed a similar study for LCB in 2019.
Due to limitations of LCB's data, RAND was only able to estimate the level of cannabis production, sales, and consumption for 2017 and 2023. Though the estimates for 2023 have a high level of uncertainty, these are the best estimates using available data.
RAND estimated that production was two to three times higher than cannabis sales from licensed retailers in 2023. Estimated consumption is higher than legal sales. This suggests that consumers get roughly 60-70% of their cannabis from licensed retailers in Washington.Figure 1: Estimated cannabis production was two to three times higher than sales in 2023

Note: Light blue and light orange lines indicate range of estimated values for THC produced and consumed.
Source: JLARC staff analysis of RAND report.
In the absence of production data, RAND relied on other data for its estimates. This included LCB data about producer canopy sizes and grow type, LCB monthly retail sales data, and detailed sales data from a private vendor.
LCB's incomplete data limits its ability to estimate production and sales and regulate the industry
LCB set up its regulatory approach to require detailed data from cannabis licensees. This approach would allow for traceability of cannabis across the supply chain. The intent of this is to do the following:
- Ensure regulatory compliance.
- Prevent diversion (product exiting the legal market to the illegal market).
- Maintain product safety.
LCB has not had a usable traceability system since 2017. That was the last year for which reliable data about cannabis production and sales was available. LCB now uses a system called the Central Cannabis Reporting System (CCRS) to collect data from cannabis licensees.
JLARC staff analysis found that CCRS data is incomplete and unreliable. RAND was unable to use CCRS data to determine the actual amount of cannabis produced and sold. Major issues with the data include:
- Sales records are incomplete. This affects the ability to quantify total sales.
- Limited ability to link data, such as inventory, product detail, and sales records. This affects the ability to quantify the amount of THC sold and the amount of THC produced.
- Weight data for wholesale cannabis is unreliable. This affects the ability to quantify the weight of cannabis produced.
|
Wholesale cannabis lots A lot of cannabis refers to:
|
The current data system does not support a data-driven approach to regulate the cannabis industry. This affects LCB's ability to promote public safety, collect correct tax revenue, and identify diversion.
LCB plans to replace CCRS with a traceability system. It estimates a new system will be fully implemented by 2031.
Until a new system is in place, LCB will likely have incomplete and unreliable data with which to regulate the cannabis industry. 88% of states with legal recreational cannabis use one of two commercial traceability systems. More than a decade after legalization, Washington's lack of a traceability system makes it an outlier among states.
Social equity program provides licenses to eligible applicants
The 2020 Legislature created the Social Equity in Cannabis Program. The program's stated goals are to:
- Reduce barriers.
- Promote equity.
- Increase participation in the industry by those adversely affected by the War on Drugs.
LCB can issue licenses to social equity applicants based on criteria defined in statute. LCB opened the first application window for 46 social equity retail licenses in 2023. The Legislature has authorized additional licenses, including:
- 100 new processor licenses, to be issued in 2023 and onward.
- 10 new producer-processor licenses, to be issued in 2025 and onward.
- 52 new retail licenses, to be issued between 2024 and 2032.
83% of states with legal recreational cannabis have social equity programs. Most of those programs have started in 2018 or later, and there is limited information about outcomes.
LCB issued nine social equity retail licenses as of February 2025. The program has reached a more racially and ethnically diverse population compared to existing licensees.
Figure 2: Washington's social equity program has reached a more racially and ethnically diverse population compared to existing licensees

Source: JLARC staff analysis of Liquor and Cannabis Board data.
Social equity producer licensees likely to face challenging market conditions
The Legislature asked JLARC staff to estimate the impact of ten new producer licenses that will be issued under the social equity program. These licenses have the potential to increase statewide cannabis canopy by 300,000 square feet, or 2.5% of the 2023 canopy.
Industry stakeholders stated that Washington's current cannabis market is challenging, especially for producer businesses. This is due to the imbalance between supply and demand, and various factors that make Washington's cannabis industry unique compared to other commodities markets.
JLARC staff analyzed turnover and survival rates for cannabis businesses. The number of cannabis producer businesses declined 31.6% since 2017. The number of retail businesses held steady over the same period. Producers have a higher five-year failure rate and year-over-year turnover rate than retailers.
This suggests that new producers are likely to encounter difficult market conditions.
Figure 3: The number of producer businesses declined since 2017, while the number of retail locations remained relatively steady

Note: 2024 data for producer and producer-processor businesses was unavailable during this study's fieldwork phase. The number of producer and producer-processor businesses is derived from Department of Revenue data. A single business may hold multiple LCB licenses. The number of retail businesses is derived from reports of sales and tax amounts to LCB. A single business may operate multiple stores.
Source: JLARC staff analysis of Department of Revenue data and Liquor and Cannabis Board data.
Legislative Auditor's recommendations
- LCB should submit a plan to the appropriate committees of the Legislature by December 31, 2025, that details the resources and funding needed to collect accurate data from licensees by December 31, 2026.
- The Legislature should consider other ways to increase social equity in the cannabis industry beyond new producer licenses.
You can find additional information in the Recommendations section.
Part 1.
Cannabis regulation in Washington
In 2012, Washington voters legalized recreational cannabis with the passage of Initiative 502. The stated goals are to:
- Focus law enforcement resources on violent and property crimes.
- Generate new state and local tax.
- Take cannabis out of the hands of illegal drug organizations and bring it under a tightly regulated, state-licensed system.
Washington and Colorado were the first states to legalize recreational cannabis. As of February 2025, 24 states had legalized recreational cannabis. At the federal level, cannabis remains illegal under the Controlled Substances Act.
The Legislature charged LCB with regulating the cannabis industry
Initiative 502, codified in Ch. 69.50 RCW, authorizes the Liquor and Cannabis Board (LCB) to do the following:
- Establish regulations for the cannabis industry.
- Issue licenses to cannabis businesses.
- Collect tax on retail sales.
LCB's regulatory framework aligns with requirements in the federal Cole Memorandum, which was issued in 2013 and rescinded in 2018.
The Cole Memorandum provided that the federal government would not intervene if states with legal cannabis prevented:
- Youth access.
- Criminal funding.
- Diversion (product exiting the legal market to the illegal market).
- Illicit trafficking.
- Violence.
- Impaired driving.
- Cultivation on public land.
- Consumption on federal property.
Initiative 502 identified three primary types of cannabis licenses: producers, processors, and retailers (Figure 4). In general, products in the cannabis industry flow from producer to processor to retailer.
Figure 4: Product generally flows from producer to processor to retailer

Note: This graphic simplifies the flow of products and excludes other events where the product can change hands, such as co-ops, research licensees, patient purchases from producers, labs, Tribal compacts, and others.
Source: JLARC staff analysis.
LCB issued the first cannabis licenses in 2014. Licenses for producers and processors were issued in 2014. LCB issued retail licenses in 2014 and again in 2016, when the medical and recreation cannabis markets merged into a single regulated industry.
In fiscal year 2024, LCB reported there were 1,671 licenses: 161 producers, 221 processors, 816 producer-processors, and 473 retailers. A single business may hold up to five retail licenses or three producer and processor licenses. Retailers cannot hold a producer or processor license.
Cannabis is mainly cultivated for tetrahydrocannabinol (THC), a compound with psychoactive effects. THC is concentrated in the plant's flowers.
Cannabis flower and other plant material is processed and sold as multiple types of products, such as:
- Loose flower (also called usable cannabis).
- Vape cartridges and pens.
- Pre-rolled joints.
- Food and beverage products (also called edibles).
- Concentrated products.
In 2023, 77% of Washington's legal retail sales were for flower, vapes, and pre-rolls (Figure 5).
Figure 5: Various cannabis products are produced and sold in Washington

Source: JLARC illustration of RAND analysis of 2023 cannabis retail sales.
Part 2.
Canopy
LCB's regulatory approach limits the cannabis canopy for each producer license.
Canopy is the square footage dedicated to growing cannabis
Canopy includes plants, regardless of size and growth stage, and the space in between them. Canopy excludes storage areas, office space, vehicle access roads, and fallow areas (e.g., outdoor fields during the winter).
This definition differs from the definition used in scientific or gardening contexts, where canopy refers to the part of a plant that is above the ground or the uppermost layer of vegetation.
Producers submit floor plans to LCB. On those floor plans, producers state the square footage they intend to cultivate. Producer licenses are categorized in three tiers based on canopy size. RAND identified 865 active licenses in 2023:
- 15% are Tier 1 (under 4,000 square feet).
- 44.4% are Tier 2 (4,000-10,000 square feet).
- 40.6% are Tier 3 (10,000-30,000 square feet).
LCB limited statewide canopy at 2 million square feet in 2013. In 2016, it amended state rules to say the maximum amount of space for production would be imposed at a later date. Although this maximum has yet to be set, WAC includes a provision that LCB may reduce licensees' canopy if the total canopy statewide exceeds the maximum.
LCB estimates between 5.3 — 13.8 million square feet of canopy
The Legislature directed JLARC staff to review LCB's previous canopy reports (SB 5080, Chapter 220, Laws of 2023).
LCB published reports about the amount of cannabis canopy statewide in 2019 and 2020. In both reports, LCB estimated about 4 million square feet of canopy, based on field observations of plant size.
In a 2023 internal report, LCB found that if all producers grew the maximum amount they were licensed for, the maximum canopy possible would be over 18 million square feet. LCB estimated a range of actual canopy between 5.3 million and 13.8 million square feet. This estimate is based on the number of plants captured in LCB's cannabis reporting system.
Limited information about production methods hinders estimates of canopy
JLARC's consultant RAND estimated that the 865 active licenses have 12.2 million square feet of canopy — roughly the area of 212 football fields.
RAND based its estimate on the following:
- Measurements of canopy square footage designated on licensee floor plans.
- Exclusion of licenses that did not report wholesale cannabis sales to the Department of Revenue or plants to LCB.
LCB and RAND both note that limited information about production methods and use of available canopy space hinder more accurate estimates of Washington's cannabis canopy. LCB maintains data about the square footage designated on licensees' floor plans and whether they grow indoors, outdoors, or both. It does not otherwise maintain detailed data about production practices.
Measuring canopy is useful for regulation, not measuring production
Limiting canopy is a common regulatory approach. LCB staff can compare observed canopy to the licensee's floor plan during site visits. Of the 24 states with legal recreational cannabis as of June 2024, 58% use canopy size to regulate production.
Figure 6: Most states regulate production using canopy size

Source: JLARC staff analysis of publicly available information about how states regulate cannabis production, June 2024.
Canopy is not a measure of the amount of cannabis produced from that space. A standard measure of cannabis output is the weight of dried flower. LCB does not collect reliable data about each producer's output (see Part 4 for more detail).
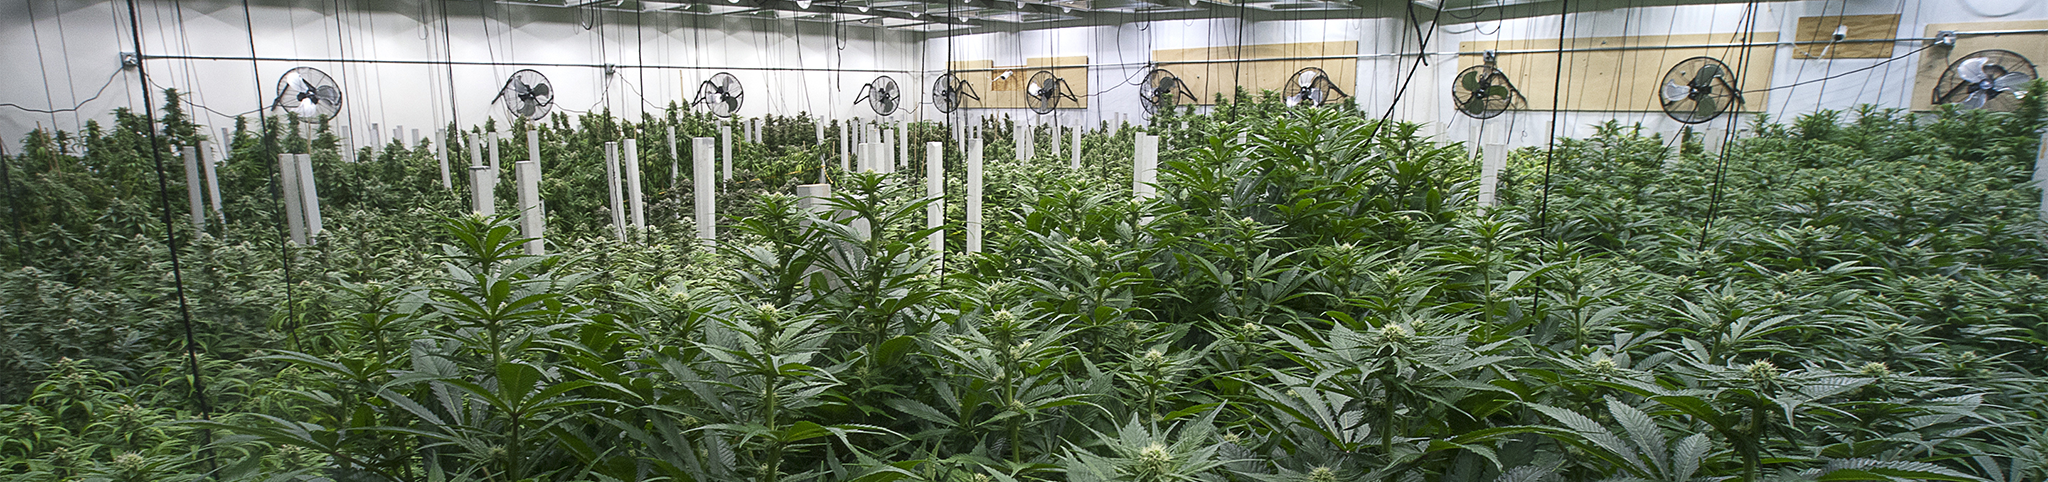
Many factors affect the amount of cannabis that can be harvested within a certain amount of space, including the growing methods, plant variety, and number of harvests per year. For example:
- Producers who grow indoors can control the environmental conditions that put cannabis plants in the flowering stage. Indoor producers may have up to six harvests per year. They may grow plants on movable trays. This eliminates the need for walkways between each row of plants.
- Producers who grow outdoors may only have one or two harvests per year. Outdoor producers typically plant cannabis directly into the ground with permanent spaces between rows of plants.
Figure 7 illustrates how the same 10,000 square feet of canopy may produce different cannabis output, depending on growing methods.
Figure 7: Identical canopy area can lead to varying crop yields
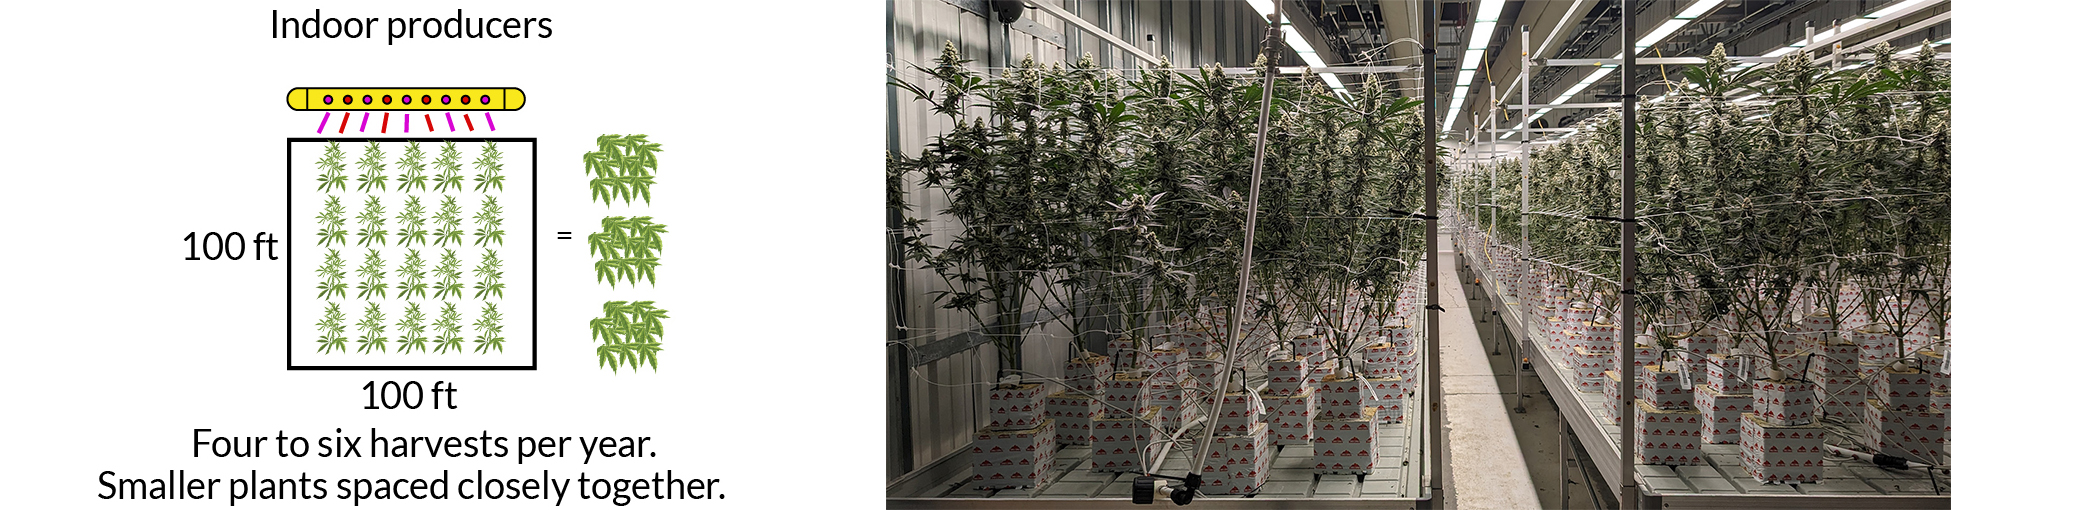
Source: JLARC staff analysis and JLARC staff photos.
Part 3.
2023 production, sales, and consumption
The Legislature directed JLARC to review whether cannabis production aligns with market demand and capacity.
JLARC staff contracted with the RAND Corporation to estimate the amount of THC produced, sold, and consumed in Washington in 2017, 2019, 2021, and 2023. RAND previously conducted a similar analysis for LCB in 2019 using data from 2016 and 2017.
Due to data limitations (see Part 4), RAND was unable to estimate production, sales, and consumption levels for 2019 and 2021. Estimates for 2023 include a high level of uncertainty due to these data limitations. However, these estimates are the best available.
RAND estimates that production was two to three times more than sales in 2023
RAND estimated that:
- Producers grew between 1.4 million and 2 million pounds of dry flower in 2023. This is roughly 292,500 to 434,000 pounds of THC. This figure excludes THC derived from non-flower parts of the plant (i.e., leaves, stems, and trimmed material).
- RAND's best estimate is 1.7 million pounds of flower.
- Retailers sold 139,000 pounds of THC in 2023.
- Washington residents consumed between 146,000 and 249,000 pounds of THC in 2023.
- RAND's best estimate is 198,000 pounds of THC were consumed. This suggests that consumers get roughly 60-70% of their cannabis from Washington's licensed retailers.
RAND compared 2023 estimates to estimates from 2017, shown in Figure 8. Estimates are not available for all years due to limitations of LCB's data. Details about RAND's methods are in Appendix B.
Figure 8: The quantity of cannabis produced, sold, and consumed in Washington increased from 2017 to 2023

Note: Due to limitations of LCB's data, estimates are unavailable for 2018-2022.
Note: Light blue and light orange lines indicate range of estimated values for THC produced and consumed in 2023.
Source: JLARC staff analysis of RAND report.
A 2024 LCB consultant report also estimated that Washington overproduces cannabis. The consultant's report estimated that:
- Maximum production capacity was 2.6 million pounds of cultivated output.
- 30% of current production was needed to meet the 1.1 million pounds of demand.
RAND's analysis supports stakeholder consensus that Washington overproduces cannabis. A high level of uncertainty in the estimates limits the ability to definitively say whether there is overproduction, or by how much.
Washington is not the only state with cannabis overproduction. In other states, including Colorado, California, and Oregon, oversupply has contributed to declining prices. A 2025 Oregon report estimated that supply was 1.75 times more than demand. The report also stated that oversupply would further decrease prices and contribute to market consolidation. Unlike Washington, Oregon is statutorily required to report about supply and demand and has consistent long-term data about its cannabis industry.
LCB's lack of quality data prevents analysis of the scale or final status of surplus cannabis: it could be illegally diverted in state or out of state, or it could be destroyed. A 2019 Washington State Institute for Public Policy (WSIPP) report noted that:
- Limits on supply capacity that are set too high could lead to surpluses.
- Cannabis that cannot be sold within the legal system may be more likely to be sold out of state.
WSIPP, like RAND, also observed that a lack of reliable data from LCB since 2017 prevented analysis of the relative scale of the illegal market. The State Auditor's Office in 2024 noted that without consistently reliable data, LCB cannot identify or prioritize risks of diversion as effectively as it could.
Retail sales peaked in 2021
JLARC staff analyzed data from LCB about cannabis retail sales (Figure 9). Total annual sales peaked in 2021 at just under $1.5 billion. Total sales in 2023 were just under $1.25 billion. For information about total sales in each county by year, see Appendix C.
Figure 9: Retail sales peaked in 2021

Note: Dollars are not adjusted for inflation.
Source: JLARC staff analysis of LCB retail sales and excise tax data.
Part 4.
Data limitations
LCB's data system, the Central Cannabis Reporting System (CCRS), currently lacks the basic information LCB needs to reliably estimate production and sales. LCB uses supplementary sources of information to determine cannabis sales. RAND noted in its review that Washington was in a much better situation to understand cannabis production in 2017 than it is today. The lack of quality data precluded a similar analysis to what RAND performed in 2019 for LCB.
LCB moved from using a full traceability system to a temporary data system
LCB designed its regulatory approach to implement state law and align with federal guidelines in force in 2013. It used a seed-to-sale tracking system (also called a traceability system) to track cannabis across the supply chain. Traceability systems generally include software, processes, and tools to track products through a supply chain and may allow real-time tracking, automated reporting, and built-in compliance management.
This approach was intended to ensure regulatory compliance, prevent diversion, and maintain product safety. LCB requires licensees to keep up-to-date data in a system of LCB's choosing.
LCB has used three main data systems to collect traceability data from licensees.
- BioTrackTHC: The first traceability system, BioTrackTHC, was in place from 2013 to 2017. BioTrack was a traceability system and contained the most reliable data about the industry.
- Leaf: This traceability system replaced BioTrack in 2017. Leaf was never fully deployed and had multiple bugs and errors.
- CCRS: The Central Cannabis Reporting System replaced Leaf in 2021. LCB staff developed CCRS as a temporary reporting solution. It is not a traceability system.
LCB's data is insufficient for answering the Legislature's questions and limits its ability to enforce regulations
JLARC staff analysis found that data in the current system — CCRS — is incomplete and unreliable. RAND was unable to use the data to determine the actual amount of cannabis produced and sold.
Figure 10: Data problems in CCRS prevent analysis of production and sales
| Problem | Examples | Affects ability to quantify |
|---|---|---|
| Sales records are incomplete. |
|
Total sales. |
| Limited ability to link data, such as inventory, product detail, and sales records. |
|
Amount of THC sold. Amount of THC produced. |
| Weight data for wholesale cannabis is unreliable. |
|
Weight of cannabis produced. |
Source: JLARC staff analysis of RAND report.
The current data system does not support a data-driven approach to regulate the cannabis industry. A data-driven approach would use industry data to proactively promote public safety, collect correct tax revenue, and identify diversion.
- Promote public safety: Tracing products across the supply chain is currently a labor-intensive, manual process, making it challenging for LCB to identify products subject to recalls.
- Verify tax revenue: CCRS does not capture all retail sales, affecting LCB's ability to ensure correct tax amounts are collected from cannabis retailers.
- Identify diversion: LCB does not know how much cannabis is produced, which affects the ability to identify and respond to diversion (product exiting the legal market to the illegal market) and inversion (product entering the legal market from the illegal market).
LCB acknowledges the limitations of CCRS. It stated in a 2024 budget request that continued reliance on CCRS may lead to compliance gaps, diversion risks, decreased public safety, and compromised regulatory oversight. LCB reports that it is enhancing CCRS to increase its functionality. However, LCB notes that CCRS is lacking for enforcement needs.
Licensees maintain data that LCB does not collect
Cannabis licensees report data to CCRS. Licensees told JLARC staff that they maintain more detailed data internally that LCB does not currently collect. For example, producers have internal inventory systems with real-time information about plants, harvests, yields, inventory, and prices.
LCB's current plan would leave the state without suitable data until 2031
LCB plans to replace CCRS with a traceability system that is intended to improve data quality. Washington is one of a few states with legal recreational cannabis that does not have a traceability system. The agency is in the planning phase to determine requirements and options for a new system. LCB estimates that it will fully implement a new system by 2031. Until a new system is in place, LCB will likely continue to have incomplete and unreliable data with which to regulate the cannabis industry.
Figure 11: Cannabis has been legal in Washington for over ten years, and LCB's current data plan will leave the state without quality data for another six years

Source: JLARC staff analysis.
Twenty-four states have legalized recreational cannabis as of February 2025. Of these, 88% use one of two commercial data systems that allow traceability of products from seed to sale. More than a decade after legalization, Washington's lack of a traceability system makes it an outlier among states.
RAND used other data for estimates due to the lack of reliable data in CCRS
In the absence of reliable data from CCRS, RAND used other data for its estimates. RAND's estimates rely on other LCB data and assumptions about factors that affect production.
To estimate production, RAND simulated cannabis crop yields using information from cannabis licensees' operating plans and assumptions about:
- Canopy use.
- Number of harvests.
- Yield per harvest.
- Whether producers were actively growing cannabis in 2023.
To estimate sales, JLARC staff bought data from a third-party software vendor that integrates with most Washington retailers' point of sale systems. The software captures detailed data about each sales transaction.
See Appendix B for more detail about RAND's approach.
Part 5.
Market conditions
The oversupply of cannabis creates challenging market conditions for producers. Other factors that are unique to the cannabis industry may also affect the viability of cannabis businesses.
Cannabis remains illegal at the federal level. Washington cannabis businesses cannot engage in interstate commerce, deduct standard business expenses from federal taxes, or qualify for traditional business loans from most banks.
State laws and regulations impose requirements. State law prohibits vertical integration of cannabis businesses. This means that retailers may not grow or process cannabis, and producers and processors may not hold retail licenses. Licensees must meet state residency requirements. Local jurisdictions may prohibit legal cannabis businesses from operating.
The illegal cannabis market competes with the legal market. This may contribute to oversupply and declining prices. RAND estimated that 30-40% of cannabis consumed in Washington in 2023 was obtained from sources other than Washington's licensed retailers.
The number of producer businesses declined by 31.6% since 2017
Industry stakeholders stated that the current market is challenging, especially for producer businesses. License and tax data shows a decline in the number of producers and a lower survival rate compared to cannabis retailers. JLARC staff's analysis is the first to quantify turnover and survival rates for cannabis businesses in Washington. JLARC staff analyzed:
- Tax data from the Department of Revenue to identify producer and producer-processor businesses over time.
- LCB tax data to identify the number of retail businesses over time.
The numbers of producer and producer-processor businesses have declined more than retailer businesses since 2017. According to the Department of Revenue data, the number of businesses with producer or producer-processor licenses that reported income peaked at 973 in 2017. The number of these businesses declined to 666 in 2023, a 31.6% decrease.
LCB's tax data shows that the number of retail businesses held relatively steady since 2018, fluctuating between 382 and 408.
Figure 12: The number of producer businesses declined since 2017, while the number of retail locations remained relatively steady
Note: 2024 data for producer and producer-processor businesses was unavailable during this study's fieldwork phase. The number of producer and producer-processor businesses is derived from Department of Revenue data. A single business may hold multiple LCB licenses. The number of retail businesses is derived from reports of sales and tax amounts to LCB. A single business may operate multiple stores.
Source: JLARC staff analysis of Department of Revenue data and Liquor and Cannabis Board data.
JLARC staff analyzed the five-year survival rate for these businesses and found the following:
- 71% of retailers survived for at least five years.
- 44% of producer and producer-processor businesses survived for at least five years.
JLARC staff analyzed the year-over-year turnover rate, to compare the number of businesses each year to the number the previous year (Figure 13). Turnover for producer and producer-processor business is 11% on average, compared to 3% for retailers.
Figure 13: Annual turnover rate is higher for producers than for retailers

Note: 2024 data for producer and producer-processor businesses was unavailable during this study's fieldwork phase. The number of producer and producer-processor businesses is derived from Department of Revenue data. A single business may hold multiple LCB licenses. The number of retail businesses is derived from reports of sales and tax amounts to LCB. A single business may operate multiple stores.
Source: JLARC staff analysis of Department of Revenue and Liquor and Cannabis Board data.
This analysis suggests that producer and producer-processor businesses face more challenges in the cannabis industry than retailers.
Part 6.
Social equity
The 2020 Legislature created the Social Equity in Cannabis Program. The program's stated goals are to:
- Reduce barriers.
- Promote equity.
- Increase participation in the industry by those adversely affected by the War on Drugs.
LCB manages the program, administers the application process, and issues licenses. The Department of Commerce manages support for licensees, including grant funding, technical assistance, and mentorship.
LCB can issue licenses to social equity applicants based on criteria defined in state law. It contracts with a third-party organization to score applications. The contractor uses an LCB-developed scoring rubric, which includes factors such as where the applicant has lived, whether they have cannabis-related arrests or convictions, and their household income.
LCB opened the first application window for 46 social equity retail licenses in 2023. The Legislature has authorized additional licenses including:
- 100 new processor licenses, to be issued in 2023 and onward.
- 10 new producer-processor licenses, to be issued in 2025 and onward.
- 52 new retail licenses, to be issued between 2024 and 2032.
As of February 2025, LCB issued licenses to nine social equity retailers. Licensees reported difficulty securing funding and a location for their business.
Outcomes of cannabis social equity programs are unclear
As of March 2025, 20 of 24 states (83%) with legal recreational cannabis had social equity programs.
Other state programs are structurally similar to Washington's. Many provide priority licensing or specific licenses to businesses that meet certain criteria. The programs also provide grant funding and other assistance to support businesses. There is limited information about outcomes for social equity programs in other states, since all programs were established in 2018 or later.
JLARC analyzed LCB's demographic data about the race/ethnicity of existing retailers and applicants for social equity retail licenses (Figure 14).
- 81% of existing retailers in 2021 were white, while 13% of the applicants for social equity licenses in 2023 were white.
- Only 4% of existing retailers in 2021 were Black or African American, while 47% of social equity applicants in 2023 were Black or African American.
- Only 2% of existing retailers in 2021 were Hispanic, while 14% of social equity applicants in 2023 were Hispanic.
Figure 14: Washington's social equity program applicants in 2023 were more diverse than existing licensees in the industry
Source: JLARC analysis of Liquor & Cannabis Board data.
This analysis suggests that the social equity program is reaching more diverse applicants compared to existing license holders.
Producers licensed through the social equity program will face challenging market conditions
The Legislature directed JLARC staff to review the impact of adding ten new producer licenses under the social equity program.
Unlike most other states, Washington legalized cannabis eight years before creating a social equity program. This means new entrants will compete with established businesses. Since there is an existing overproduction of cannabis, new producers are likely to face challenging market conditions. As discussed in Part 5, producer businesses have declined in number since 2017 and have a higher turnover rate than retail businesses.
New producer licenses under the social equity program will have a minimal effect on cannabis production
Ten new producer licenses issued under the social equity program will likely have a minimal effect on cannabis production capacity. RAND estimated that existing producers had roughly 12.2 million square feet of canopy in 2023. If all ten new producer licenses were Tier 3 (10,000 to <30,000 square feet), they would add up to 300,000 square feet of licensed canopy, an increase of 2.5% (Figure 15).
Figure 15: Ten new producer licenses would have a minimal effect on total canopy

Source: JLARC staff analysis of SB 5080 and RAND report.
Better information about production and sales would enable more informed decision-making
There is limited data available about the cannabis industry to help the Legislature and LCB make informed policy decisions.
JLARC staff's analysis found an oversupply of cannabis and declining numbers of producer businesses. This suggests that new cannabis producers may face challenging conditions. If social equity producer businesses are unable to remain in business, the effect on equity among producer-processor licensees will be limited. More accurate data about production and sales would enable more informed decision-making about the social equity program.
Recommendations
The Legislative Auditor makes two recommendations.
Recommendation #1:
LCB should submit a plan to the appropriate committees of the Legislature by December 31, 2025, that details the resources and funding needed to collect accurate data from licensees by December 31, 2026.
The plan should identify the data elements LCB needs to determine production and sales levels and efficiently carry out its statutory responsibilities of ensuring regulatory compliance, preventing diversion, and promoting public safety. The plan should identify the resources needed to collect accurate data from licensees by December 31, 2026.
Legislation required: None
Fiscal impact: None
Implementation date: December 31, 2025
Agency response: To be included in proposed final report.
Recommendation #2:
The Legislature should consider other ways to increase social equity in the cannabis industry beyond new producer licenses.
JLARC staff's analysis found that new producers entering the industry may face challenging market conditions. In 2022, the Social Equity in Cannabis Task Force recommended creating new types of cannabis licenses exclusive to social equity applicants, such as delivery and social consumption licenses. It also recommended increasing funding to support social equity licensees. Legislation has been introduced that would allow cannabis consumption events and allow producers to sell directly to customers.
Legislation required: Yes
Fiscal impact: Varies depending on approach.
Implementation date: NA
Agency response: To be included in proposed final report.
Agency Response
To be included in proposed final report.
Current Recommendation Status
JLARC staff follow up on the status of Legislative Auditor recommendations to agencies and the Legislature for four years. The most recent responses from agencies and status of the recommendations in this report can be viewed on our Legislative Auditor Recommendations page.
Appendices
Appendix A: Applicable statutes | Appendix B: RAND methodology | Appendix C: Retail sales by county and year | Appendix D: Study questions & methods | Appendix E: Audit authority
Appendix A: Applicable statutes
Chapter 69.50 RCW | 69.50.325-395 relate specifically to cannabis
Appendix B: RAND methodology
View RAND's summary of methodologies
Appendix C: Retail sales by county and year
The link below will open a dashboard that displays the total retail sales by county and year. The data is from LCB's tax unit, which collects data on a monthly basis from licensed retailers about the total sales and excise tax owed. This data is collected independently of LCB's Central Cannabis Reporting System (CCRS). Data is self-reported by retail licensees. JLARC's consultant, RAND, matched sales recorded in the LCB data to the county in which the sales were made for sales beginning in 2016. Approximately $84.7 million out of $9.3 billion in sales were excluded because they cannot be matched to a county.
View dashboardAppendix D: Study questions
This study aimed to answer the following questions, which were presented to JLARC in September 2023 (view here).
- How does cannabis production compare to market demand and capacity?
- How much canopy is licensed and how much cannabis is produced?
- How much cannabis do retailers sell?
- What is the demand for cannabis in Washington?
- What is the estimated impact on the cannabis market of the ten new producer licenses issued
under the Social Equity in Cannabis Program?
- What is the estimated impact on equity in the cannabis industry?
- What information is available about other factors that could affect the viability of and equity in the cannabis industry?
Methods
The methodology JLARC staff use when conducting analyses is tailored to the scope of each study, but generally includes the following:
- Interviews with stakeholders, agency representatives, and other relevant organizations or individuals.
- Site visits to entities that are under review.
- Document reviews, including applicable laws and regulations, agency policies and procedures pertaining to study objectives, and published reports, audits or studies on relevant topics.
- Data analysis, which may include data collected by agencies and/or data compiled by JLARC staff. Data collection sometimes involves surveys or focus groups.
- Consultation with experts when warranted. JLARC staff consult with technical experts when necessary to plan our work, to obtain specialized analysis from experts in the field, and to verify results.
The methods used in this study were conducted in accordance with Generally Accepted Government Auditing Standards.
More details about specific methods related to individual study objectives are described in the body of the report under the report details tab or in technical appendices.
Appendix E: Audit Authority
The Joint Legislative Audit and Review Committee (JLARC) works to make state government operations more efficient and effective. The Committee is comprised of an equal number of House members and Senators, Democrats and Republicans.
JLARC's nonpartisan staff auditors, under the direction of the Legislative Auditor, conduct performance audits, program evaluations, sunset reviews, and other analyses assigned by the Legislature and the Committee.
The statutory authority for JLARC, established in Chapter 44.28 RCW, requires the Legislative Auditor to ensure that JLARC studies are conducted in accordance with Generally Accepted Government Auditing Standards, as applicable to the scope of the audit. This study was conducted in accordance with those applicable standards. Those standards require auditors to plan and perform audits to obtain sufficient, appropriate evidence to provide a reasonable basis for findings and conclusions based on the audit objectives. The evidence obtained for this JLARC report provides a reasonable basis for the enclosed findings and conclusions, and any exceptions to the application of audit standards have been explicitly disclosed in the body of this report.
JLARC members on publication date
SenatorsLeonard Christian Keith Goehner Bob Hasegawa Liz Lovelett Jesse Salomon, Chair Shelly Short Keith Wagoner, Secretary |
RepresentativesStephanie Barnard April Berg Jake Fey Stephanie McClintock Ed Orcutt, Vice Chair Gerry Pollet, Assistant Secretary
|