JLARC Final Report: K-12 Health Benefits
Report 15-6, January 2016
Legislative Auditor's Conclusion:
Consolidation and other options are available to the Legislature to improve equity and affordability of full-family health care coverage for K-12 employees
K-12 employees pay 7.6 times more for full-family coverage than for employee-only coverage
School districts have made slight improvement toward the Legislature’s affordability goal. This goal, set in 2012, states that health insurance premiums for full-family coverage should not be more than three times the premiums for employee-only coverage. However, in the 2013-2014 school year, only 27 out of 295 districts met this ratio. In addition, not all districts comply with other legislative requirements that could improve affordability for family coverage.
Consolidation and other options may improve equity and affordability
The figure below presents the current system and three general options for addressing key components of health benefits systems: purchasing (selecting insurance carriers and plans offered), and administration (deciding eligibility and cost-sharing).

Option A would improve equity and affordability of family coverage and would reduce local decision-making and likely increase employer costs.
Options B and C might make less progress on equity and affordability of family coverage and would retain some local control.
Districts and local bargaining units also have discretion to improve equity and affordability without legislative action. Few have done so to date.
Mixed progress on other legislative goals and requirements
The 2012 Legislature established additional goals and requirements for the K-12 health benefits system such as improving transparency, promoting health care innovations, and reducing administrative costs. School districts and insurance carriers have made mixed progress on these legislative goals and requirements.
No Legislative Auditor recommendation
This report identifies policy options but makes no audit recommendations.
Other impacts
If the Legislature makes changes to the K-12 health benefits system, there may be implications related to the State Supreme Court’s decision in the McCleary case. The McCleary decision indicated that employee benefits are part of compensation. The Court noted compensation is related to recruiting and retaining competent K-12 staff.
- Equity & Affordability Not Achieved
- Consolidation is an Option
- Other Options Exist
- Mixed Progress on Other Goals
- Current K-12 Health Benefit System
- Appendix 1: More about the 3:1 Ratio
- Appendix 2: District Equity Ratios
- Appendix 3: Consolidation Scenarios
- Appendix 4: Methodology and Sources
School districts and collective bargaining units have made slight improvement in equity and affordability for full-family coverage, but most have not met target
In 2012, the Legislature set goals of greater equity between premiums for full-family and employee-only coverage and greater affordability for full-family health benefit coverage (ESSB 5940).
Benefits are collectively bargained in each of the 295 school districts, so achieving these goals requires actions by school districts and the bargaining units. The exhibit below shows how the current system performs in meeting the Legislature’s affordability and equity goal and other requirements established in its 2012 legislation. Useful background information can be found in the tabs on the left: Current K-12 Health Benefit System; and Appendix 1: More about the 3:1 Ratio.
| Equity/affordability goal and other requirements | Current System |
|---|---|
| Improve affordability of full-family coverage | Wide variation exists for employee premiums. Average monthly premium for employee-only coverage was $69, while full-family coverage was $527. |
| Improve the equity ratio | Full-family coverage cost, on average, 7.6 times more than employee-only coverage.Only 27 of 295 districts had ratios of 3:1 or better. |
| Target pooled funds to employees insuring their families | The approach to pooled funds in many districts reduces the amount available to employees covering their family members. |
| All employees pay a minimum | 196 school districts had at least one employee who had health coverage but did not pay any premium. |
| Employees pay more for richer plans | 55 out of 160 surveyed school districts stated that all or some of their employees do not pay more for richer plans. |
One measure of affordability is the dollar amount that K-12 employees pay for coverage
The Office of the Insurance Commissioner (OIC) reports that, in 2013-2014, K-12 employees with employee-only coverage paid average monthly premiums of $69. Employees with full-family coverage paid average monthly premiums of $527.
These averages mask wide variation. For some plans, employees paid no premiums for either employee-only or full-family coverage. For other plans, employees paid nearly $1,000 per month for employee-only and $1,800 for full-family coverage.
Full-family coverage costs an average of 7.6 times more than employee-only coverage
| Law Requires | The Legislature chose to measure the relative affordability of full-family coverage with an equity ratio: How much an employee pays for full-family coverage divided by what an employee pays for employee-only coverage. The ratio changes when either amount increases or decreases. There are no penalties to districts if they do not reach the 3:1 ratio. The 2012 legislation did not set a maximum ratio, interim ratios, or a date to achieve the target. The statewide ratio has been improving (getting smaller) in each of the three years OIC has collected data. Few districts met the 3:1 target in any of the three school years. District equity ratios are available in Appendix 2. |
| Districts must make progress toward premiums for full-family coverage that are not more than three times the premiums for employee-only coverage for the same plan. This is also discussed as a 3:1 ratio. | |
| What We Learned | |
| K-12 employees insuring their families paid an average of 7.6 times more for health care coverage than employees insuring only themselves. Only 27 of 295 districts had ratios of 3:1 or better. (Source: OIC 2013-2014 data) |

Of the 27 districts reaching the 3:1 target ratio in 2013-14:
- 2 (Tacoma and Everett) adopted health benefit systems that closely resemble the health benefit system used for state employees (PEBB)
- 13 purchased health insurance for all or the majority of their employees from PEBB
- 12 purchased insurance through other carriers
Statewide and district average ratios mask greater variation at plan level
The district ratios above are averages that include all plans offered within each district. However, the Legislature’s 3:1 target applies to individual plans, not districts as a whole. The exhibit below shows the ratios based on some plans offered in one Western Washington school district, demonstrating how the individual plans within a district can vary significantly from the district average.
| Employee-Only | Full-Family | Equity Ratio | |
|---|---|---|---|
| Example District Average (weighted for plan enrollment) |
$48 | $606 | 13:1 |
| Plan A | $3 | $848 | 283:1 |
| Plan B | $3 | $678 | 226:1 |
| Plan C | $60 | $1,037 | 7:1 |
| Plan D | $61 | $943 | 15:1 |
| Plan E | 139 | $1,222 | 9:1 |
| Plan F | $152 | $1,313 | 9:1 |
| Plan G | $0 | $258 | N/A |
| Plan H | $0 | $374 | N/A |
Most districts share pooled funds with all employees, widening the gap between individual and family premiums
| Law Requires | If an individual employee is ineligible for coverage, selects a low-cost plan, or waives coverage, then some of the funds allocated for that employee are available to be pooled for others. Bargaining units pool these funds and then share them among other employees in the same bargaining unit to reduce premiums. JLARC staff interviewed districts that share pooled funds equally among employees in the bargaining unit who are eligible to receive them. This approach can worsen the equity ratios, as shown in the exhibit below. |
| Pooled funds shall be “made available by the districts to reduce out-of-pocket premium expenses for employees needing basic coverage for dependents …” | |
| What We Learned | |
| Based on collective bargaining, in many districts, pooled funds are shared among employees regardless of the family size covered. This approach reduces the amount available to employees covering other family members. |

Another section of the law calls for equal shares of pooled funds to be used for other benefits. It states, “Each full-time employee included in the pooling arrangement, regardless of the number of dependents receiving basic coverage, receives the same additional employer contribution for other coverage or optional benefits.” Examples of optional benefits are short-term disability and life insurance. This section of the law has been interpreted by some school districts to mean pooled funds must be shared equally with all employees, even those not covering family members.
Affordability of full-family coverage could improve if all employees paid some amount for coverage, but many do not
| Law Requires | The insurance carrier charge is paid by contributions from the state, school district, and employees. If each employee paid a premium, there could be additional funds available from the state and district contributions. These funds could be pooled and used to offset premiums for full-family coverage. Statute does not establish a minimum required amount or minimum percent for employees to pay. It is up to the school districts and the bargaining units to determine the minimum amount. In the 2013-2014 school year:
|
| The 2012 legislation called for each employee to pay a minimum premium charge, subject to collective bargaining. | |
| What We Learned | |
| 196 school districts had at least one employee who had health coverage but did not pay any premium.(Source: OIC 2013-2014 data) |
Not all employees pay more when selecting a plan that covers more of their health costs
| Law Requires | Insurance carriers charge more for richer benefit plans. Richer plans include more benefits or pay more of the costs through lower copayments and deductibles. The metal levels (e.g., platinum and gold plans) used in the Affordable Care Act are one example of classifying higher or lower levels of plan richness. The 2012 bill did not specify how to accomplish this statutory requirement.
OIC data indicates that K-12 employees selecting employee-only coverage enroll in richer plans (typically equivalent to the federal platinum level) and pay less of the carrier charge. Employees selecting full-family coverage enroll in less rich plans (typically equivalent to the federal gold level) and pay more of the carrier charge. |
| Employee premiums must be set to ensure that employees selecting richer benefit plans pay a higher premium. | |
| What We Learned | |
| 55 out of 160 school districts responding to a survey for this report stated that all or some of their employees do not pay more for richer plans. |
Consolidating the K-12 system would improve family coverage equity and affordability while reducing local decision-making and increasing state costs
The 2012 legislation directed the Health Care Authority (HCA) to examine the impacts of a single, consolidated benefits system for K-12 employees (ESSB 5940).
HCA’s consolidation option is one of three general options explored in this report for improving full-family affordability and equity. Under the full consolidation option, the state would select insurance carriers and plans. The state also would determine employee eligibility and cost-sharing. Consolidation would decrease local decision-making and local level bargaining.

HCA considered six scenarios to consolidation
In its June 2015 report, K-12 Employee Benefits – Equity, Affordability, and the Impacts of System Consolidation, HCA modeled six scenarios that are consistent with the consolidation option above. The modeling conducted by HCA and its actuaries is based on two years of school district data because the 2013-2014 school year data was not yet available.
- Two scenarios place K-12 employees into the Public Employees Benefits Board (PEBB).
- Four scenarios consolidate K-12 employees under a School Employees Benefits Board (SEBB). A SEBB would be a separate board that would provide insurance benefits only to K-12 employees.
JLARC staff contracted with an independent actuarial firm to review the approach and analysis by HCA. The actuarial firm observed that there are uncertainties involved with this type of work, but stated that the assumptions and methods appear sound and the HCA conclusions are reasonable.
HCA finds that consolidation could improve affordability and equity
Compared to the current K-12 system of health benefits, all six consolidation scenarios have the effects illustrated below to various degrees.
| Affordability/equity goal and other requirements | Option: Full Consolidation |
|---|---|
| Improve affordability of full-family coverage? | Yes. The scenarios assume reduced premiums for full-family coverage. |
| Improve the equity ratio? | Yes. The scenarios assume that premiums for employee-only coverage increase while full-family premiums drop. This improves the equity ratio. |
| Target pooled funds to employees insuring their families? | Funds are pooled from the onset so no redistribution is necessary. |
| All employees pay a minimum? | Yes. The scenarios ensure all employees pay something for their health insurance. |
| Employees pay more for richer plans? | Yes. The scenarios ensure employees pay more for richer plans. |
The HCA scenarios have these additional impacts:
- Decrease the number of employees waiving coverage
- Increase part-time employee and family member enrollments
- Increase employer costs
Two scenarios illustrate variation in cost and enrollment
Two of the HCA scenarios, one PEBB scenario and one SEBB scenario, are discussed in more detail in Appendix 3. These scenarios are provided to illustrate some of the variation in costs and enrollment associated with different assumptions.
Options short of full consolidation might make less progress on equity and affordability of family coverage and would retain some local control
The Legislature has other options that could improve family coverage equity and affordability without moving K-12 employees into the Public Employees Benefits Board (PEBB) or creating a School Employees Benefits Board (SEBB).
Two such options, illustrated below, would make adjustments to two key components of health benefits systems: purchasing (selecting insurance carriers and plans offered) and administration (deciding eligibility and cost-sharing). These options are not mutually exclusive.

Option B: Local purchasing, State sets administrative guidelines on cost-sharing
Under this option, the Legislature could allow districts to continue independent selection and purchasing of insurance carriers and plans and to continue local bargaining on eligibility. Local bargaining could also continue on cost-sharing, but the Legislature could set guidelines for how bargaining would take place.
| Guidelines: | |
|---|---|
|
|
| Affordability/equity goal and other requirements | Effect of Option B |
| Improve affordability of full-family coverage? | Yes. The extent of the gain would depend on the guidelines the Legislature sets. There would likely be a price increase for employee-only coverage. |
| Improve the equity ratio? | Yes, but it would depend on the minimum and maximum percentages of carrier charges employees would be required to pay. |
| Target pooled funds to employees insuring their families? | Yes, depending on how the Legislature clarified the pooling statutes. |
| All employees pay a minimum? | Yes. All employees would pay at least a minimum percentage set by the Legislature. |
| Employees pay more for richer plans? | Yes. Because employees pay a percentage, they pay more when selecting richer plans. |
The impact of this option on the Legislature’s goal of more affordability and equity for employees who insure their families would depend on the guidelines the Legislature selects. For example:
- If the Legislature established minimum percentages of carrier charges that all employees would pay and disallowed use of flat fees, all employees would pay some amount and would pay more for richer plans.
- If the Legislature established a uniform percentage for all employees to pay, as it does with PEBB, it could achieve the target equity ratio of 3:1.
Option C: State purchasing (selects carriers and plans), local administration
Under this option, the state would select the insurance carriers and plans from which the school districts and collective bargaining units could choose. This could reduce the richness of plans available to K-12 employees. Decisions about eligibility and cost-sharing would continue to be collectively bargained at the local level.
This option would likely have less of a direct impact on affordability and equity than Option B.
| Affordability/equity goal and other requirements | Effect of Option C |
|---|---|
| Improve affordability of full-family coverage? | Potentially. Any improvement would depend on a less-rich plan menu, increased pooled funds, and local decisions to target those funds to assist with full-family coverage. |
| Improve the equity ratio? | Potentially. If employees, especially those selecting employee-only coverage, pay a minimum amount for coverage, equity ratios should improve. |
| Target pooled funds to employees insuring their families? | No guarantee of compliance. These elements would continue to be subject to local collective bargaining agreements. |
| All employees pay a minimum? | |
| Employees pay more for richer plans? |
Potential to improve affordability by reducing the richness of plans
State level purchasing could reduce the richness of plans offered to potentially achieve additional savings. Insurance carriers typically charge less for plans that have less rich benefits. If the plans have carrier charges for employee-only coverage that are below the state allocation, the resulting increase in pooled funds could offset premiums for full-family coverage. However, how pooled funds were used would still be subject to collective bargaining.
In the 2013-2014 school year, 43 percent of enrolled K-12 employees (46,000) were in plans that are equivalent to the federal platinum level. In contrast, all state employees enrolled in PEBB are at the gold level.
Districts and local bargaining units have discretion to improve equity and affordability without legislative action, but few have done so to date
School districts and local bargaining units can improve affordability of family coverage and equity without further legislative action. Twenty-seven school districts worked with their bargaining units to achieve an average 3:1 ratio under the current system.
For example, both Tacoma and Everett school districts provide employee benefits under a trust, and all employee groups have voluntarily joined together to purchase health care. State health benefit allocations are pooled prior to becoming available to pay for benefits. Both districts have equity ratios below 3:1.
School districts and insurance carriers have made mixed progress on other legislative goals and requirements
The 2012 legislation set additional goals and requirements for school districts and their insurance carriers (ESSB 5940).
| Goals and Requirements | What We Learned |
|---|---|
| Improve the transparency of health benefit plan claims and financial data | Improvement at state level, mixed or no progress for districts and employees |
| Promote health care innovations and cost savings | Innovations offered, but no cost savings reported |
| Reduce administrative costs | Carrier costs lower, district costs mostly unknown |
| Offer a high deductible health plan option with a health savings account | Plans offered, but little enrollment |
| Offer at least one health benefit plan with an 85/15 cost split | Unclear how many districts comply |
| Achieve greater parity in state allocations for state employee and K-12 employee health benefits | No change in state allocations |
Mixed improvement in transparency of health benefit claims and financial data
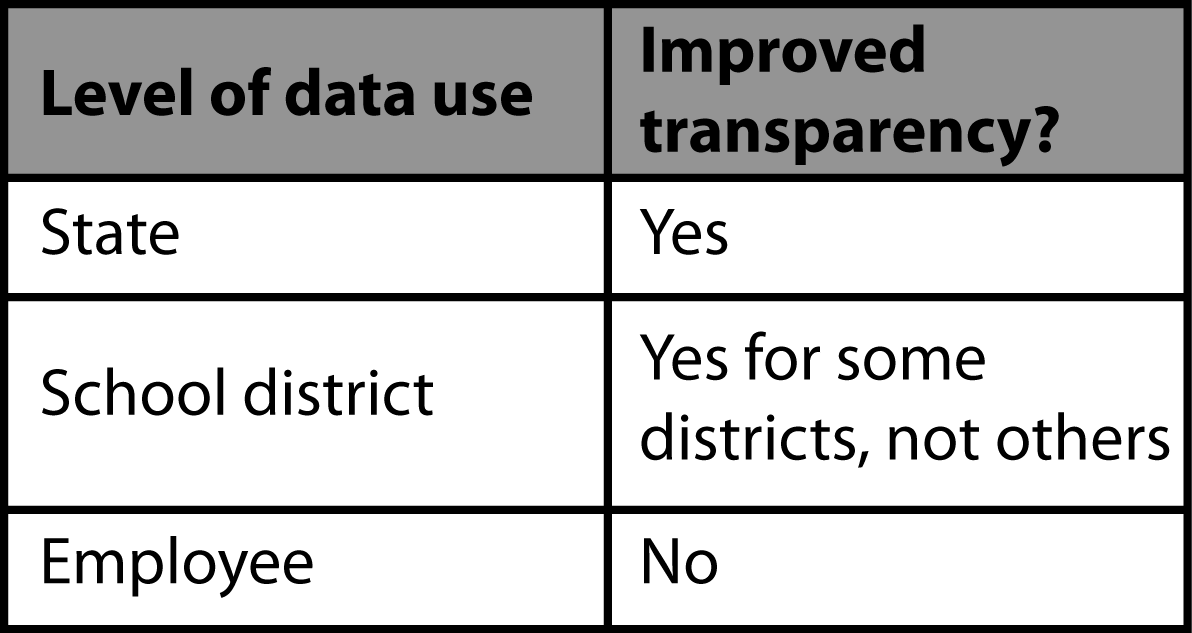
The 2012 legislation included a goal to improve the transparency of health benefit plan claims and financial data to ensure prudent and efficient use of taxpayers’ funds at the state and local levels. The Legislature directed the Office of the Insurance Commissioner (OIC) to collect data from school districts and insurance carriers to improve transparency.
As a result of the data collection efforts by OIC, the health benefit cost and enrollment data available at the state level is greatly improved.
However, at the district level, many districts still do not have access to their aggregate (not individual) claims data which is important for competitive procurement.
- Districts that contract directly with insurance carriers can access their data if the contract provides access.
- 228 of the 295 districts contract with the Washington Education Association (WEA) to offer at least one plan WEA negotiated with an insurance carrier. Because WEA, not the district, has the relationship with the carrier, districts do not have access to claims data for the WEA plan(s) they offer.
Transparency at the employee level has not improved. K-12 employees typically do not see what their premiums will be when they select an insurance plan. Rather, they have the total carrier charge from the insurance carrier. This charge is different from the premium employees will pay, after accounting for factors like bargaining and pooling (see Appendix on 3:1 ratio). K-12 employees often do not see the impacts of pooling on their premiums until after they have selected plans.
This lack of transparency for K-12 employees is in contrast to state employees, who see what premiums are associated with different plans and levels of family coverage before they make a plan selection.
Districts report health care innovations but not cost savings
OIC worked with insurance carriers to develop a list of 33 health care innovations and asked districts which items the districts had or were pursuing.
- More than half of the districts reported having 25 or more of the 33 health care innovations. For example, nearly every district reported innovations such as charging copays for emergency room services to reduce inappropriate use and charging higher copays for brand drugs when generic drugs are available.
- About one-third of districts reported offering employees an opportunity to complete biometric screenings or provide wellness incentive programs.
School districts did not report specific cost savings in the data collected by OIC. However, many districts provided examples of ways they are attempting to control costs. Some said they are working with carriers and brokers to eliminate high cost plans and design plans to be affordable while meeting employee needs. Several districts reported to OIC that it is hard to achieve costs savings when carrier charges continue to increase.
Insurance carrier administrative costs are lower, but district administrative costs mostly unknown
Insurance carriers reported to OIC that carrier administrative costs were $67.1 million in 2012 and were $58.8 million in 2014. This is a drop from 5.9 percent of total carrier charges in 2012 to 5.5 percent in 2014.
OIC notes that reporting on district administrative costs is inconsistent and incomplete.
- 48 districts reported internal administrative costs to OIC in 2013-2014.
- 84 districts responding to a JLARC staff survey said that administrative staff costs have gone up as they take steps to comply with the 2012 legislation.
Little enrollment in high deductible plans with health savings accounts
High deductible health plans (HDHPs) are lower cost coverage options that may help reduce health benefit expenditures for both employers and employees. Based on OIC data, it appears that all districts are complying with the requirement to offer an HDHP with a health savings account (HSA), but overall enrollment is low. Less than one percent of employees selected an HDHP in the 2013-2014 school year.
A way of encouraging enrollment into HDHPs is for employers to make a contribution into an employee’s health savings account (HSA). Officials at six districts indicated to JLARC staff that they did not make employer contributions to HSAs because they believed that such contributions are illegal. The Office of the Superintendent of Public Instruction issued an opinion that it is legal for school districts to make contributions to health savings accounts.
Few districts appear to offer a plan with an 85/15 cost split
Available OIC data does not indicate how many districts offer a plan in which the district pays 85 percent of the carrier charge and the employee pays 15 percent. Only 1 out of the 20 school districts interviewed by JLARC staff offered such a plan.
The cost of full-family coverage exceeds the amount that districts receive from the state for an employee. To viably offer this plan, premiums paid by employees selecting employee-only coverage must offset the costs of employees selecting coverage for family members. However, district pooling practices do not allow this to happen.
No change in state allocations for K-12 and state employees
In addition to improving affordability and equity for full-family coverage, the Legislature also established the goal of greater parity in state allocations for state employee and K-12 employee health benefits. In the 2013-2014 school year, the Legislature allocated $768 per month for insurance benefits for each full-time equivalent (FTE) K-12 certificated staff and $884 per month for each K-12 classified FTE. In 2014, the Legislature allocated $840 per month for insurance benefits for each eligible state employee.
The two PEBB scenarios estimate funding that might be needed to provide parity in terms of the benefits employee receive. It is a policy decision for the Legislature to determine if it wants to make changes to state allocations.
K-12 health insurance benefit expenses are shared by the state, school districts, and employees
Eligible K-12 employees receive health insurance benefits from the school districts where they work. In 2013, the state and school districts spent $1.1 billion in public funds to purchase health insurance benefits for more than 200,000 K-12 employees and their family members.
The amount charged by the insurance carrier for coverage is shared by the state, school districts, and employees. This study focuses on the employee contribution, which this report refers to as the premium.

In some cases employees do not pay any premium to cover part of the carrier charge.
K-12 system is more complex than the system used for state employees
The K-12 employee health benefit system operates differently from the health benefit system used for state employees (PEBB) in four key ways. Local bargaining for K-12 employees yields wide variation and complexity in the system.
- Employee eligibility and contributions vary widely for K-12 employees, but are the same for all state employees under PEBB
- The amount and calculation for the state allocation differs
- The approach to employee allocation and pooling differs
- K-12 system has more carriers and plans than PEBB
| K-12 Employees | State Employees | |
|---|---|---|
| Full-time | Eligible | Eligible |
| Part-time | Eligibility varies based on collective bargaining agreement | Employees who work at least half-time (80 hours/month) are eligible |
| Employee contribution | Varies by bargaining unit. Some employees pay nothing. | 15% of carrier charge |
| K-12 Employees | State Employees | |
|---|---|---|
| Amount | On average State allocates funds for 72% of carrier charge | On average State pays 85% of carrier charge |
| Which employees | State allocates for all funded FTEs regardless of eligibility | State pays only for eligible employees |
| State monthly allocation | $768 for full-time certificated staff $884 for full-time classified staff The classified allocation amount is not intended to provide a higher level of benefits for classified staff, but rather to accommodate for a difference in FTE calculations. Both allocation amounts are prorated for part-time staff |
$840 per eligible employee |
| K-12 Employees | State Employees | |
|---|---|---|
| Approach | Defined contribution | Defined benefit |
| Approach defined | Districts hold a specific amount of money for the employee to put towards his or her health insurance premium every month | State pays 85% of the carrier charge, rather than a set amount |
| Pooling | State allocation for ineligible employees distributed to others | No pooling |
| K-12 Employees | State Employees | |
|---|---|---|
| Selected by | Collective bargaining by unit within each district | Public Employees Benefits Board (PEBB) |
| Carriers | 10, including PEBB | 3 |
| Plans | 438 | 7 |
Legislation in 2012 set goals for the K-12 health benefit system and called for this JLARC study
In 2012, the Legislature set four goals for the K-12 health benefits system (ESSB 5940):
- Create greater affordability for full family coverage and greater equity between premium costs for full-family coverage and for employee-only coverage for the same health plan;
- Provide greater parity in state allocations for state employee and K-12 employee health benefits;
- Improve the transparency of health benefit claims and financial data to assure prudent and efficient use of taxpayers’ funds at the state and local level; and
- Promote health care innovations and cost savings, and significantly reduce administrative costs.
The same legislation established new data collection requirements and called for new studies. The bill directed:
- The Office of the Insurance Commissioner (OIC) to annually collect enrollment, carrier charges, employee premium, and claims data from school districts and their insurance carriers;
- The Health Care Authority (HCA) to examine options for a single, consolidated K-12 health benefits system, based in part on the new data collected by OIC; and
- JLARC staff to assess the progress school districts are making in meeting the legislative goals, using the OIC data, and to evaluate the consolidation options presented in the HCA report.
Legislature selected a 3:1 equity ratio as a target for affordability
Legislation in 2012 directed school districts to make progress on premiums to ensure that full-family coverage premiums are not more than three times the premiums for employee-only coverage for the same plan. This translates to an equity ratio of 3:1.
Health Care Authority views 3:1 equity ratio as reasonable
As part of its June 2015 study on options for consolidation of the K-12 health benefits system, the Health Care Authority (HCA) reviewed the appropriateness of the 3:1 equity ratio. HCA found the target ratio to be reasonable and equitable. It is the same ratio state employees pay under their health benefits system.
If equity is viewed as having employees pay an equal percentage of what an insurance carrier typically charges for coverage, then a 3:1 ratio is appropriate. Carrier charges for full-family coverage are typically no more than three times as much as the carrier charges for employee-only coverage for the same plan.
Equity between premiums is determined by collective bargaining, not insurance carriers
Carriers typically offer plans to PEBB and Washington school districts with tiers such as employee-only and full-family (i.e., employee, spouse, and children). Carriers set the charge for tiers in each plan based on historical information about how many people were covered and what health care services they used. Very few plans offered by carriers to school districts in the 2013-2014 school year had charges for full-family coverage that were greater than three times the price for employee-only coverage. The employee share of the carrier charge (the employee’s premium) is set through collective bargaining.
The exhibit below shows an insurance carrier may offer plans with a 3:1 ratio, but the ratio between premiums employees paid for full-family and employee-only coverage may be much higher due to collective bargaining.

Source: JLARC staff depiction of ratio calculations.
The table linked here provides health benefits information for each of the 295 school districts for the 2013 - 2014 school year. Data presented includes numbers of enrolled employees, average premiums paid by employees for full-family and employee-only coverage, and the equity ratio for these two tiers. Columns in the table are sortable using the arrows in the column headings.
Two scenarios illustrate variation in cost and enrollment
These two Health Care Authority (HCA) scenarios are provided to illustrate some of the variation in costs and enrollment associated with different assumptions about employer/employee cost-sharing and prorating the employer’s contribution based on the number of hours an employee works. In both scenarios, employees currently receiving benefits but working less than half-time are grandfathered in at the half-time level.
HCA used two years of data collected by the Office of the Insurance Commissioner, as well as additional data collected by HCA and its actuaries, to analyze how enrollment and costs for both employers and employees might change based on different eligibility and cost-sharing assumptions.
For example, the HCA analyses project how employees wanting to insure their families would respond to lower prices for full-family coverage.
School district and carrier data for the 2013-2014 school year was not available to HCA for its report. HCA displays its results to show impacts to certificated and classified staff combined and separately. A link to the full report is in Appendix 4.
JLARC contracted with an independent actuarial firm to review the approach used by HCA in its analysis. The actuarial firm concluded that while the methods involved a level of uncertainty, the assumptions and methods appeared reasonable.
HCA Scenario 1: Moving K-12 employees into PEBB would add 38,750 people to the system, lower full-family coverage costs, and increase employee-only coverage costs
In this scenario (Scenario 1 in the HCA report), all K-12 employees are moved into the Public Employees Benefits Board (PEBB) program with state employees. The scenario assumes:
- All K-12 employees who work at least half-time are fully eligible for health benefits without any prorating of the employer contribution;
- All employees pay a premium of 15 percent of what the insurance carrier charges, regardless of the plan selected or the number of family members covered; and
- The benchmark for calculating costs is the Uniform Medical Plan, the plan in which the majority of state employees are enrolled.
| Affordability/equity goal and other requirements | Option: Move K-12 employees into PEBB Program |
|---|---|
| Improve affordability of full-family coverage? | Yes. Average monthly premiums for full-family coverage drop from $485 to $234. Average monthly premiums for employee-only coverage increase from $48 to $81. |
| Improve the equity ratio? | Yes. HCA estimates the ratio would improve from 10:1 to 2.9:1 |
| Target pooled funds to employees insuring their families? | Funds are pooled from the onset so no redistribution is necessary. |
| All employees pay a minimum? | Yes. In this scenario, all employees pay 15 percent |
| Employees pay more for richer plans? | Yes. Because employees pay a percentage, they pay more when they select richer plans. |
Note: HCA modeling was conducted prior to OIC Year 3 data becoming available.
Under this PEBB scenario, many employees who previously waived coverage would opt back in, and some employees who had opted for employee-only coverage would add their family members. HCA projects that 8,750 additional K-12 employees (mainly part-time employees) and 30,000 additional family members would enroll.
HCA estimates these additional employees and family members would enroll because the employee premiums for family coverage would be lower under a consolidated system than current premiums available in the school districts. These lower rates would provide an incentive to join the consolidated system rather than seek coverage elsewhere.
In this scenario, the net annual cost to the employer increases by $182 million.
- Employer costs go up by $100 million per year because the employer pays a larger share of the carrier charges for most employees enrolling family members.
- Employer costs increase by another $82 million because employees enroll more family members when premiums for family coverage become more affordable.
In this scenario, employee premiums decrease, but the number of people enrolled increases. The total employee premiums have a net annual decrease of $21 million.
- Employee costs go down by nearly $99 million per year. Many employees would pay a lower share of the carrier charges for plans covering family members, but employees would pay more for employee-only coverage.
- Employees pay an additional $78 million a year by covering previously uninsured family members.
HCA Scenario 3b: Moving K-12 employees into a SEBB would add more than 26,000 people to the system, lower full-family coverage costs, and increase employee-only coverage costs
In this scenario (HCA Scenario 3b), all K-12 employees are moved into a School Employees Benefits Board (SEBB). This scenario assumes:
- All K-12 employees who work at least half-time are eligible for health benefits, but the employer contribution is prorated based on the number of hours the employee works;
- For employee-only coverage, a full-time employee’s premium is 12 percent of the insurance carrier charge ;
- For full-family coverage, a full-time employee’s premium is 30 percent of the carrier charge;
- The benchmark for calculating costs is the Washington Education Association – Premera Plan 2, which is the plan most often selected by K-12 employees.
| Affordability/equity goal and other requirements | Option: Move K-12 employees into a SEBB |
|---|---|
| Improve affordability of full-family coverage? | Yes. Average monthly premiums for full-family coverage drop from $485 to $272. Average monthly premiums for employee-only coverage increase from $48 to $112. |
| Improve the equity ratio? | Yes. HCA estimates the ratio would improve from 10:1 to 2.4:1. |
| Target pooled funds to employees insuring their families? | There are no pooled funds in the sense of K-12 pools. Funds are pooled from the onset so no redistribution is necessary. |
| All employees pay a minimum? | Yes. In this scenario, employees pay between 12 and 30 percent. |
| Employees pay more for richer plans? | Yes. Because employees pay a percentage, they pay more when they select richer plans. |
Note: HCA modeling was conducted prior to OIC Year 3 data becoming available.
In this scenario, the net annual cost to the employer increases by more than $82 million.
- Employer costs go up by $36 million per year because the employer pays a larger share of the carrier charges for employees enrolling family members.
- Employer costs increase by another $46 million because premiums for family coverage become more affordable, and employees enroll more family members.
In this scenario, the total employee premiums have a net annual increase of nearly $18 million. Premiums for employees with dependents decrease, and the number of people enrolled increases.
- Employee costs go down by over $37 million per year because employees pay a lower share of the carrier charges for plans covering family members.
- Employees pay an additional $55 million a year by covering previously uninsured family members.
Study data collected by JLARC staff as well as the Office of Insurance Commissioner and Health Care Authority
Methodology
JLARC analysts used various methods to study the issues addressed in this report. These methods included reviewing applicable state laws, agency policies and procedures, and information obtained from agency staff; reviewing information on K-12 health benefit funding; and interviewing school district officials and union representatives. In addition, analysts used the following specific methods to assess the Legislature’s four goals established in ESSB 5940:
- Analysts reviewed and analyzed both confidential and publically available data collected by the Office of Insurance Commissioner (OIC) for the 2011-2012 through 2013-2014 school years. Analysts also reviewed the Health Care Authority’s (HCA) 2015 report titled, “K-12 Employee Benefits—Equity, Affordability, and the Impacts of System Consolidation.” This JLARC report makes extensive use of the OIC data and the HCA report.
- Analysts also conducted 20 site visits of school districts across Washington between November 2014 and June 2015. During those visits, analysts spoke with school district officials, health benefit insurance brokers, and union representatives.
- JLARC staff contracted with The Social & Economic Sciences Research Center (Center) from Washington State University to conduct “A Survey of K-12 School Districts in Washington State,” which was sent to school district superintendents in August 2015. Of the 295 school districts the Center contacted, 175 school districts completed or partially completed the survey for a response rate of 60 percent. School district officials responded to questions related to the four goals the Legislature established in ESSB 5940.
- JLARC analysts met with representatives from the Washington Education Association (WEA), the Public School Employees (PSE), and the Washington Association of School Business Officers (WASBO). Additionally, JLARC analysts met with the WASBO Payroll/Personnel/Retirement Committee and were assisted by school district business officers in developing and field testing the school district survey instrument.
- JLARC staff contracted with the actuarial firm of Towers Watson for health benefits actuarial expertise. Towers Watson helped JLARC analysts review technical aspects of HCA’s 2015 report and responded to technical questions throughout the course of the study.
- JLARC analysts were also part of stakeholder groups assembled by OIC and HCA that met multiple times from 2013 through 2015. The groups consisted of staff from OIC, HCA, and the Office of the Superintendent of Public Instruction; representatives from PSE, WEA, WASBO, and the Washington Association of School Administrators; legislative committee staff; and Office of Financial Management staff. Also participating were representatives from OIC’s data collection vendor, Treinen and Associates, and from HCA’s health care actuaries from Milliman and Roberts.
Sources
Office of the Insurance Commissioner: K-12 School District Health Benefits Information and Data Collection Project
- Year 1 report and exhibits (November, 2013)
- Year 2 report and exhibits (November, 2014)
- Year 3 report and exhibits (November, 2015)
Health Care Authority: K-12 Employee Benefits – Equity, Affordability, and the Impacts of System Consolidation (June, 2015)
A Survey of K-12 School Districts in Washington State (August, 2015)
This report identifies policy options but makes no audit recommendations.
The Office of the Insurance Commissioner (OIC), the Health Care Authority (HCA), and the Office of Financial Management (OFM) were given an opportunity to comment on this report. All three agencies responded that they did not have comments on this report.
Contact
Authors of this Study
John Bowden, Research Analyst, 360-786-5298
Steven Meyeroff, Research Analyst, 360-786-5176
John Woolley, Audit Coordinator
Keenan Konopaski, Legislative Auditor
Joint Legislative Audit and Review Committee
Eastside Plaza Building #4, 2nd Floor
1300 Quince Street SE
PO Box 40910
Olympia, WA 98504-0910
Phone: 360-786-5171
FAX: 360-786-5180
Email: JLARC@leg.wa.gov
Audit Authority
The Joint Legislative Audit and Review Committee (JLARC) works to make state government operations more efficient and effective. The Committee is comprised of an equal number of House members and Senators, Democrats and Republicans.
JLARC's non-partisan staff auditors, under the direction of the Legislative Auditor, conduct performance audits, program evaluations, sunset reviews, and other analyses assigned by the Legislature and the Committee.
The statutory authority for JLARC, established in Chapter 44.28 RCW, requires the Legislative Auditor to ensure that JLARC studies are conducted in accordance with Generally Accepted Government Auditing Standards, as applicable to the scope of the audit. This study was conducted in accordance with those applicable standards. Those standards require auditors to plan and perform audits to obtain sufficient, appropriate evidence to provide a reasonable basis for findings and conclusions based on the audit objectives. The evidence obtained for this JLARC report provides a reasonable basis for the enclosed findings and conclusions, and any exceptions to the application of audit standards have been explicitly disclosed in the body of this report.
Committee Action to Distribute Report
On January 6, 2016 this report was approved for distribution by the Joint Legislative Audit and Review Committee.
Action to distribute this report does not imply the Committee agrees or disagrees with Legislative Auditor recommendations.
JLARC Members on Publication Date
Senators
Randi Becker
John Braun, Chair
Sharon Brown
Annette Cleveland
David Frockt
Bob Hasegawa
Mark Mullet, Assistant Secretary
Ann Rivers
Representatives
Jake Fey
Larry Haler
Christine Kilduff
Drew MacEwen
Ed Orcutt, Secretary
Gerry Pollet
Derek Stanford, Vice Chair
Drew Stokesbary
Scope & Objectives
Why a JLARC Study on Purchase of School District Employee Health Benefits?
In 2011, the Legislature modified and established goals for the system of health care benefits for K-12 employees (ESSB 5940). The legislation included timeframes for the school districts to accomplish the goals and directed the Joint Legislative Audit and Review Committee (JLARC) to conduct an audit of the progress school districts are making in meeting the goals.
School District Employee Health Benefits
Employee health benefits and coverage are negotiated in each of the 295 school districts, and costs vary between, and even within, school districts for similar benefits. While the state currently contributes $768 per month per full-time equivalent employee for benefits, the amounts school districts contribute and the employee’s share of premium costs can vary significantly, especially for employees with dependents.
In November 2014, the Office of the Insurance Commissioner reported that $1.03 billion in public funds was spent annually for health benefits at school districts, covering nearly 202,000 employees and dependents.
Goals for the K-12 Health Benefits System
The Legislature established the following goals:
- Improve the transparency of health benefit plan claims and financial data to assure prudent and efficient use of taxpayers' funds at the state and local levels;
- Create greater affordability for full family coverage and greater equity between premium costs for full family coverage and for employee only coverage for the same health benefit plan;
- Promote health care innovations and cost savings, and significantly reduce administrative costs; and
- Provide greater parity in state allocations for state employee and school district employee health benefits.
Study Scope
JLARC staff will report on the progress school districts and their benefit providers are making toward the legislatively established goals for the K-12 health benefits system, as reported by the Office of the Insurance Commissioner and the Health Care Authority. If adequate progress is not being made, the report will review what legislative and agency actions might help to remove barriers to progress. The study will also examine options for consolidating purchasing systems for K-12 employees.
Study Objectives
As directed in statute, JLARC staff will address the following objectives:
School District Progress
- Assess the progress school districts and their benefit providers have made in:
- Improving transparency of health benefit plan claims and financial data;
- Creating greater affordability for full family coverage and greater equity between premium costs for full family coverage and employee-only coverage; and
- Promoting health care innovations and cost savings, and reducing administrative costs.
- If districts have not made adequate progress on the legislative goals, assess:
- Reasons why adequate progress has not been made; and
- If legislative or agency actions could help remove barriers to improvement.
Options for Consolidated Systems
- Assess advantages and disadvantages of consolidated purchasing of health insurance for certificated and classified staff:
- As separate employee groups or combined;
- Through the Public Employee Benefits Board; or
- Through the creation of a school employee health benefits purchasing system.
For the assessment of consolidation options, JLARC staff will review analysis being conducted by the Health Care Authority, with an emphasis on progress toward statutory goals and cost impacts.
Timeframe for the Study
Staff will present the preliminary and final reports at JLARC meetings in December 2015 and January 2016, respectively. In the same timeframe, JLARC staff are also conducting a separately mandated study on the cost and feasibility of shifting some part-time K-12 and higher education employees to the state’s health benefit exchange.