The Local Infrastructure Finance Tool (LIFT) was enacted in 2006 and expires in 2044. Under LIFT, the state provides financial support for local infrastructure projects in designated areas called Revenue Development Areas (RDAs). LIFT is based on a premise that investments in public infrastructure will attract private development and increase economic activity. The economic activity is expected to generate tax revenue that meets or exceeds the state's contribution.
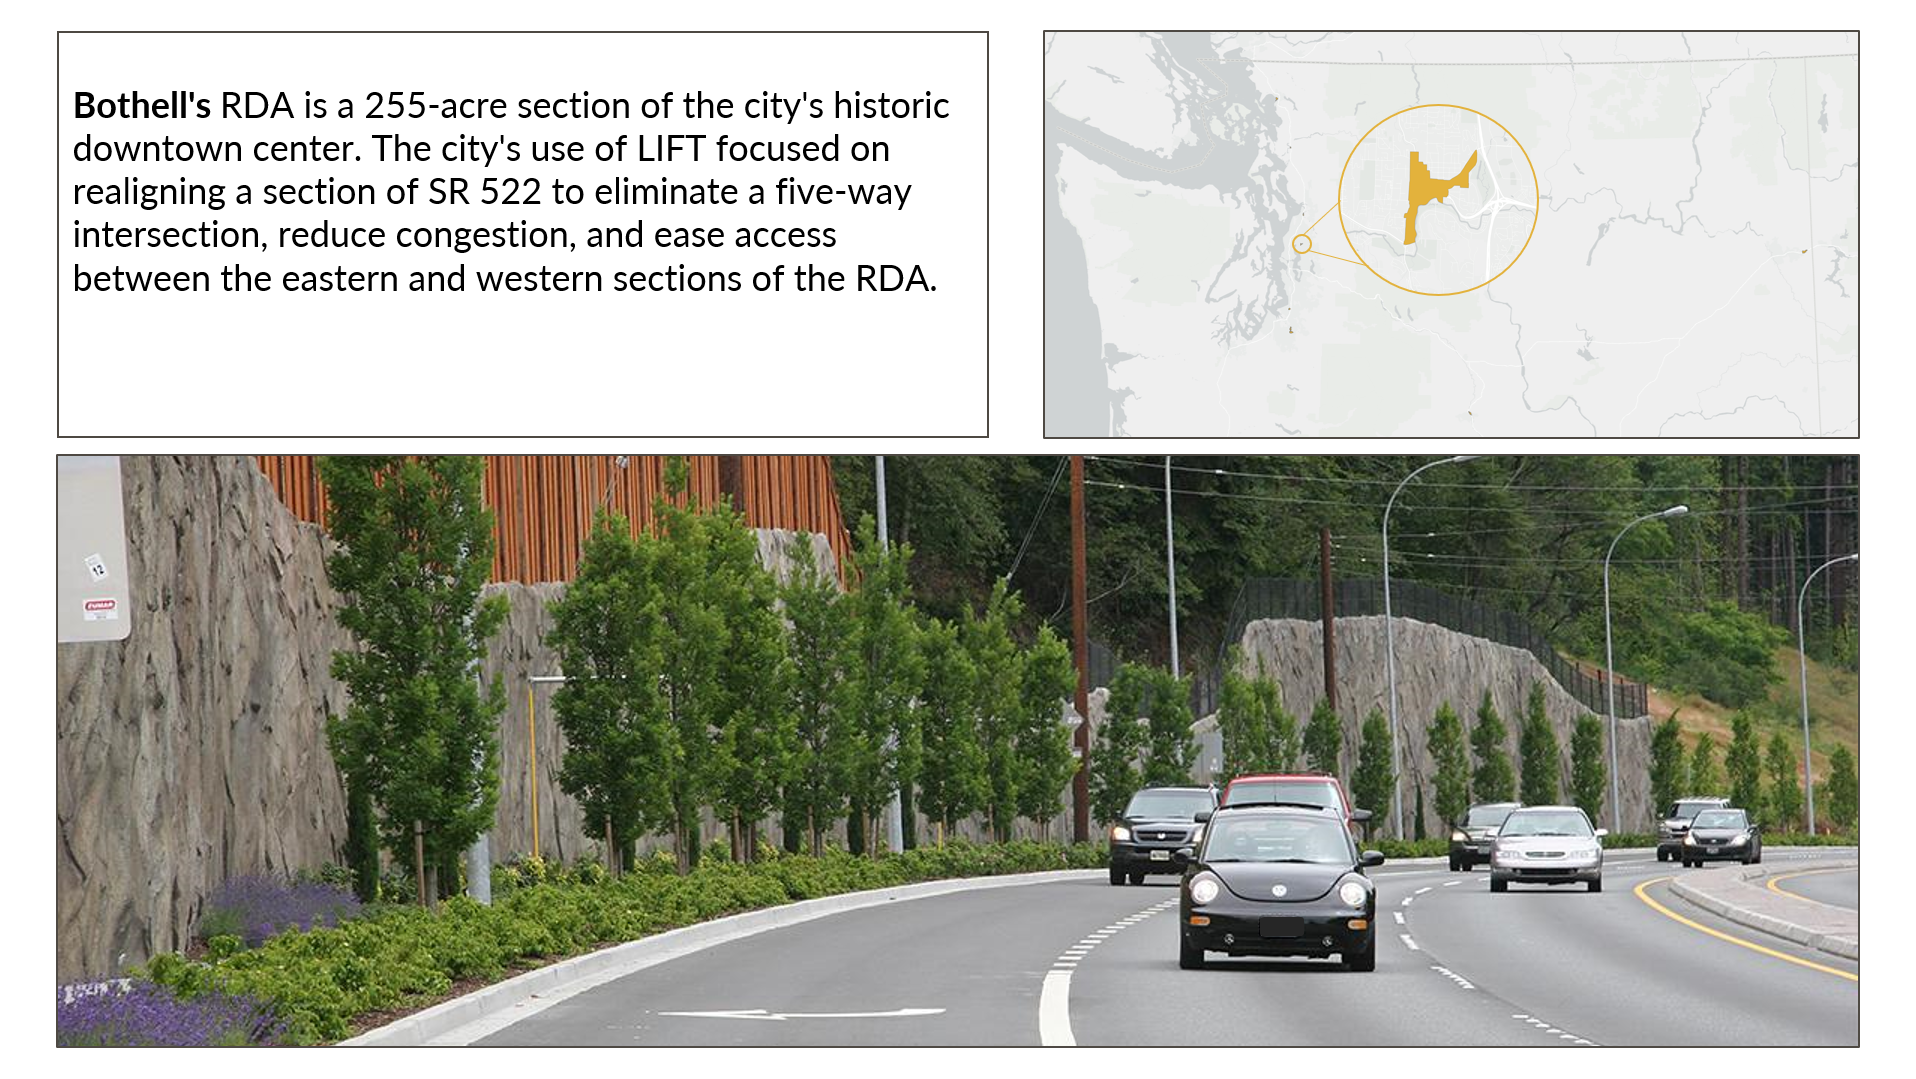
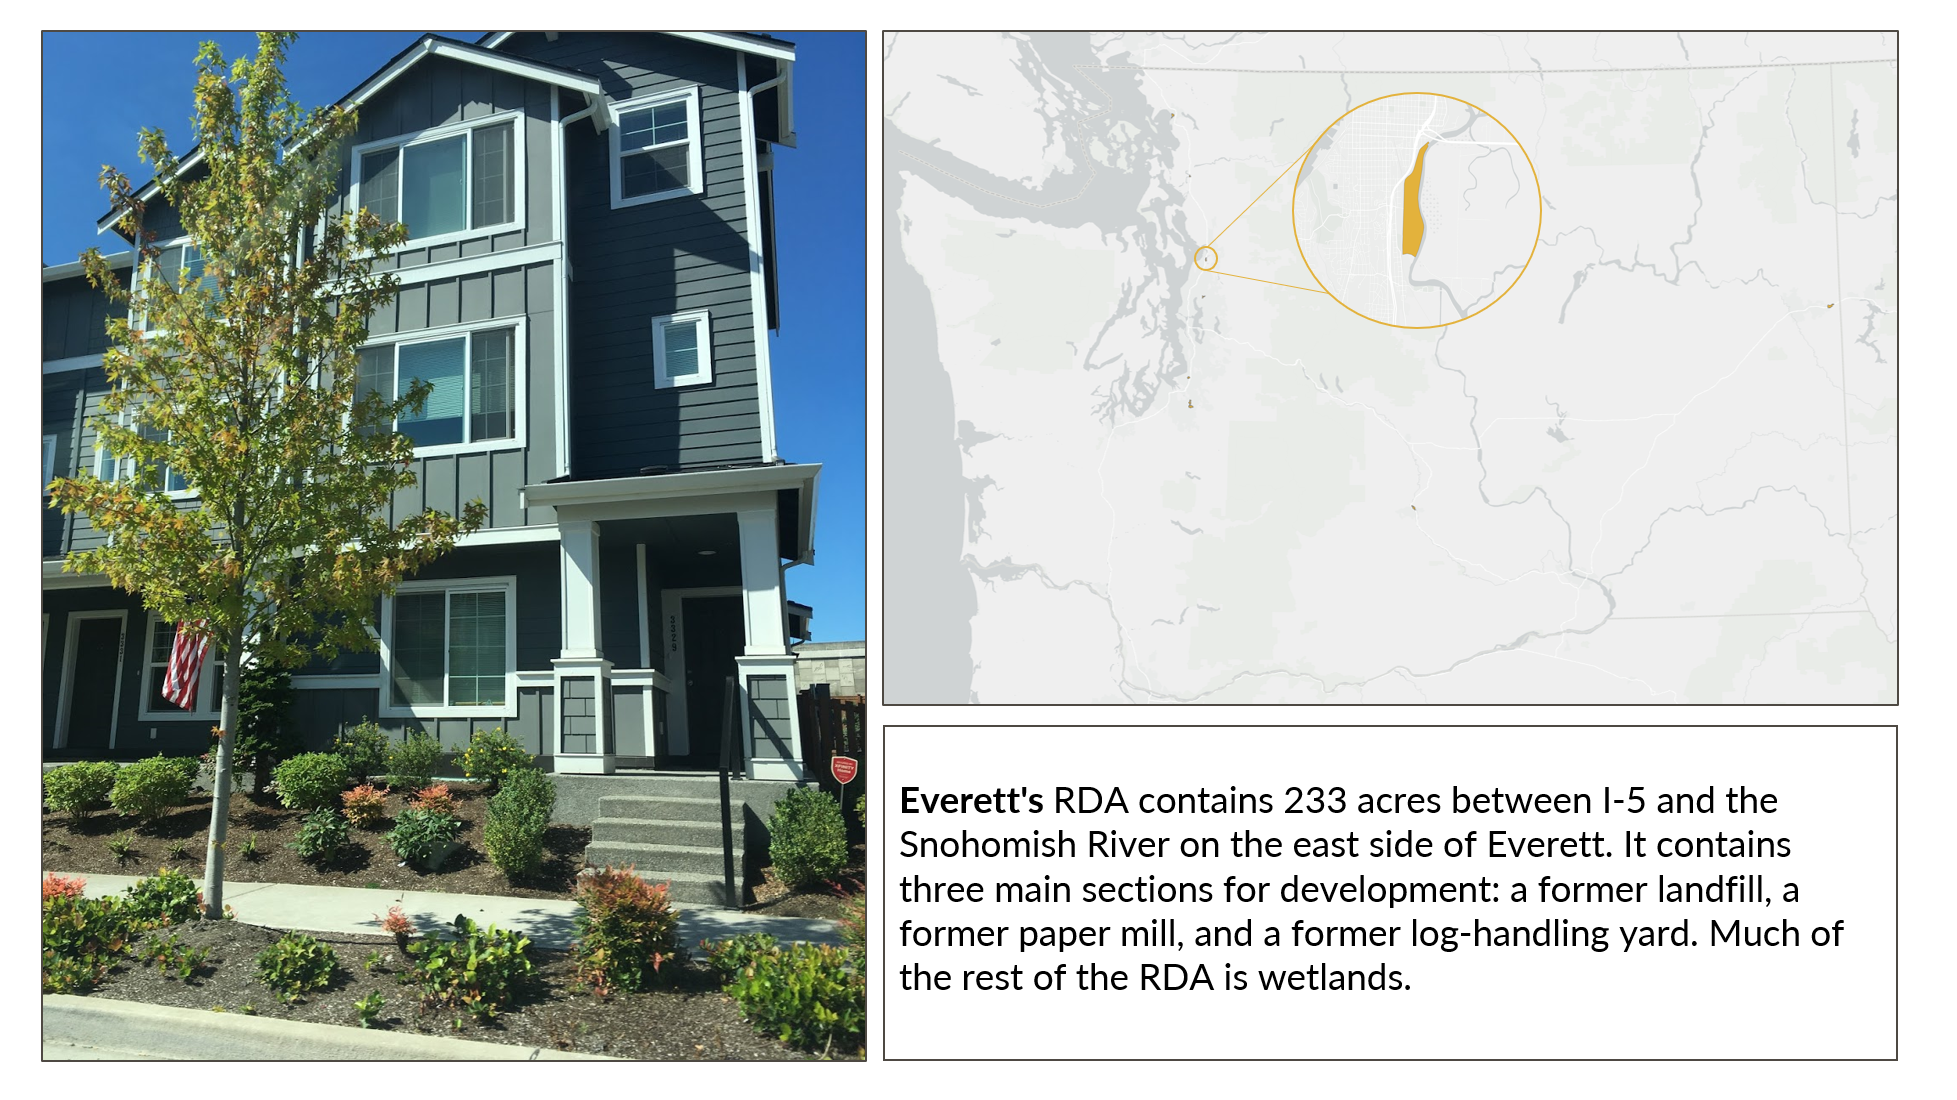
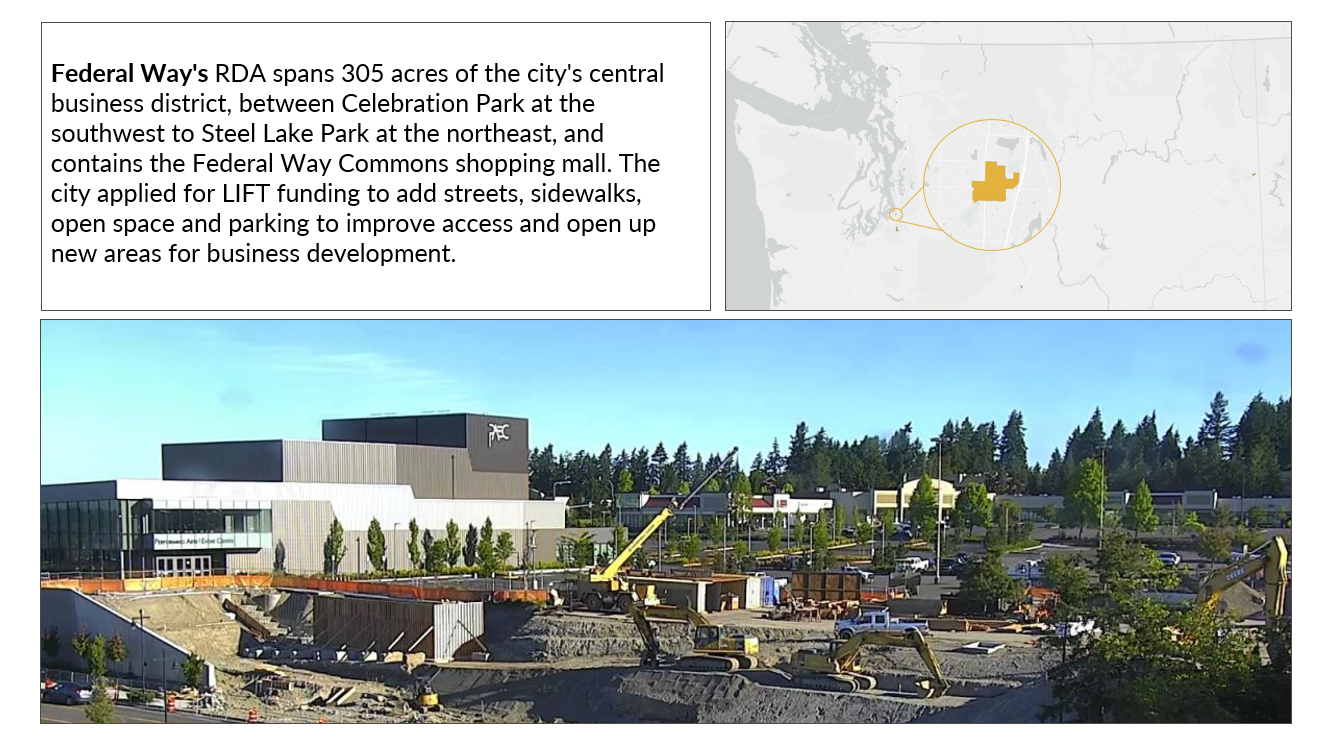
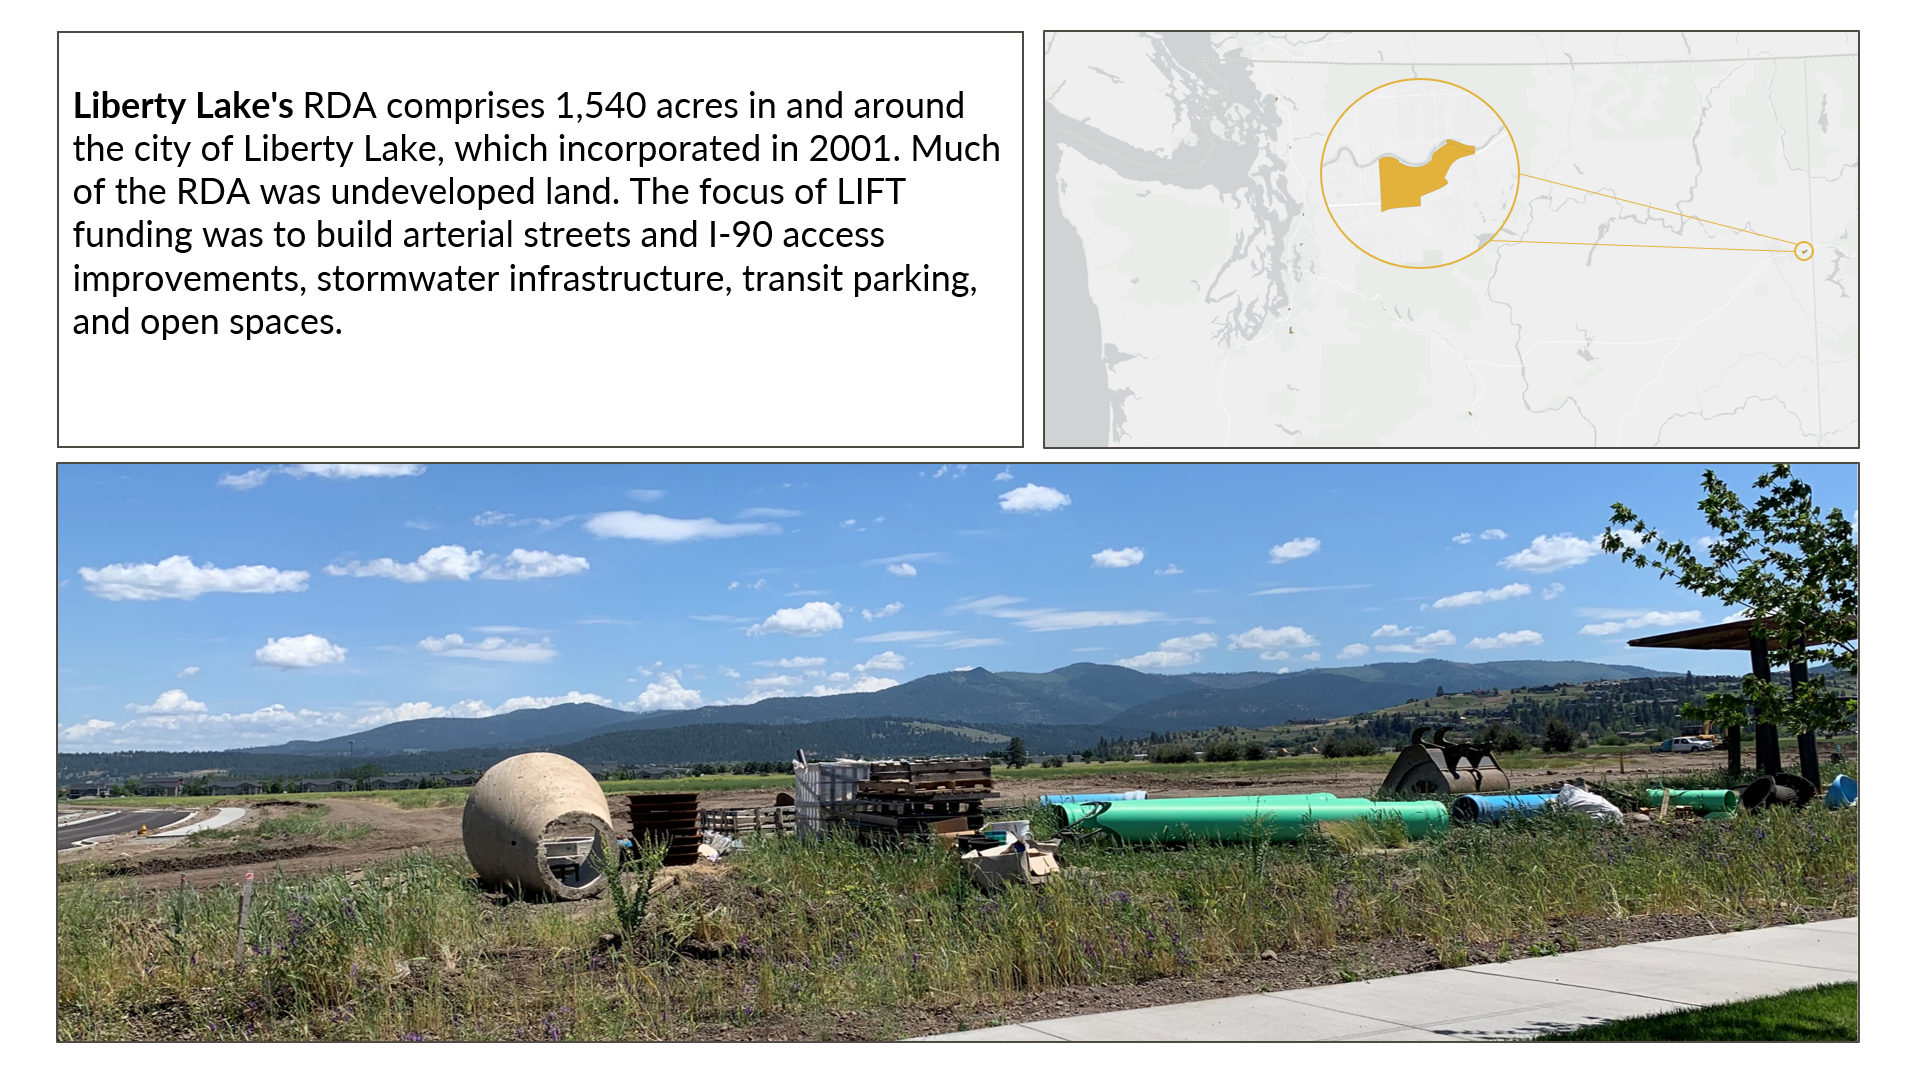
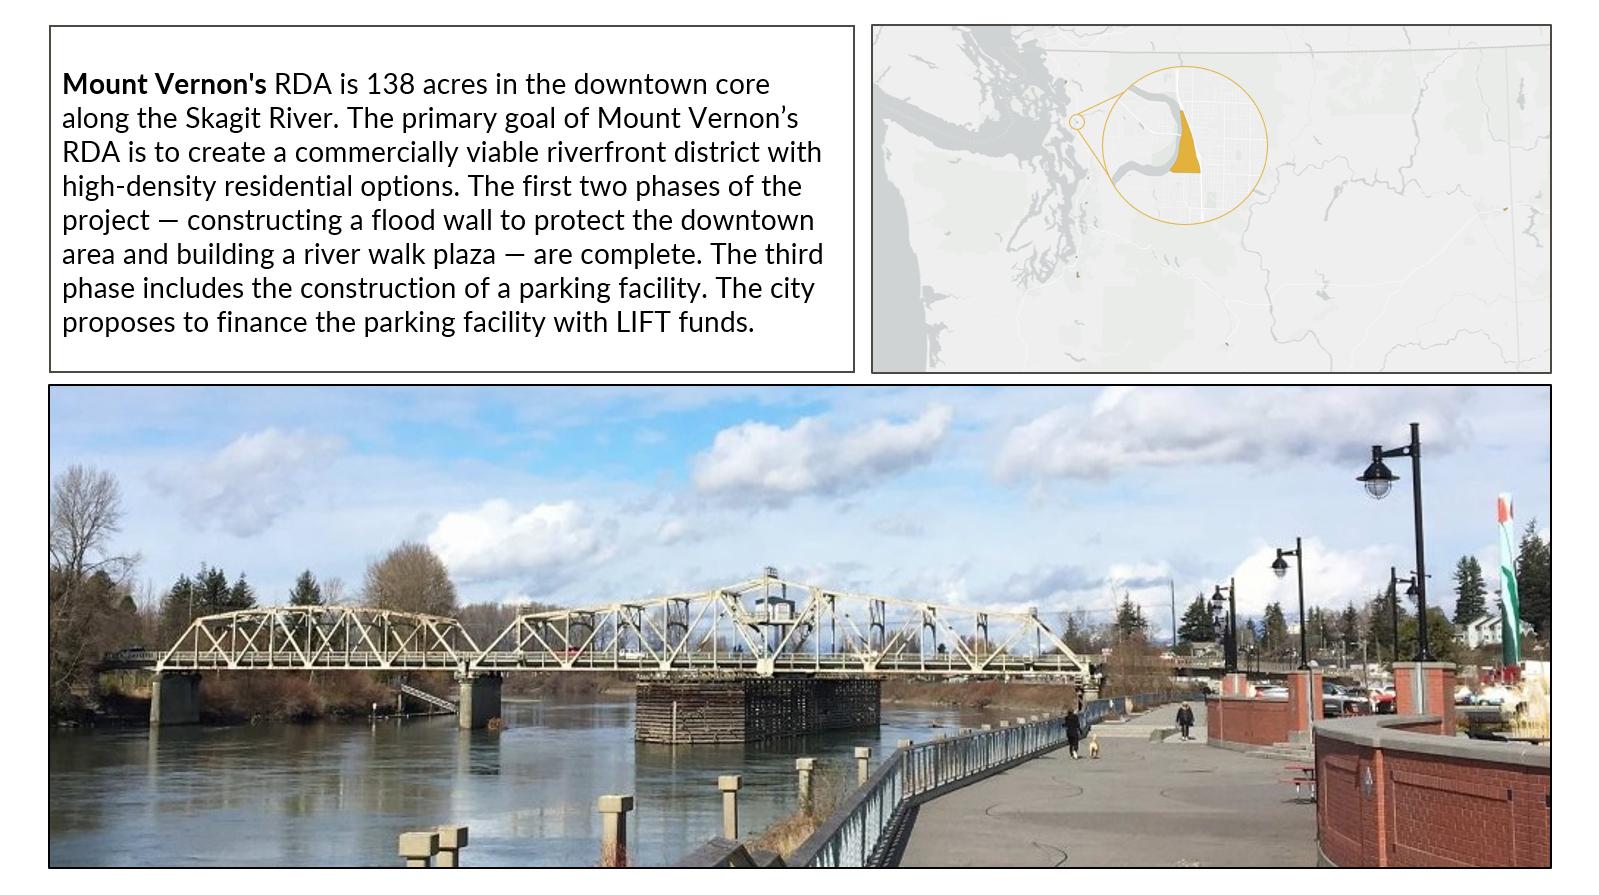
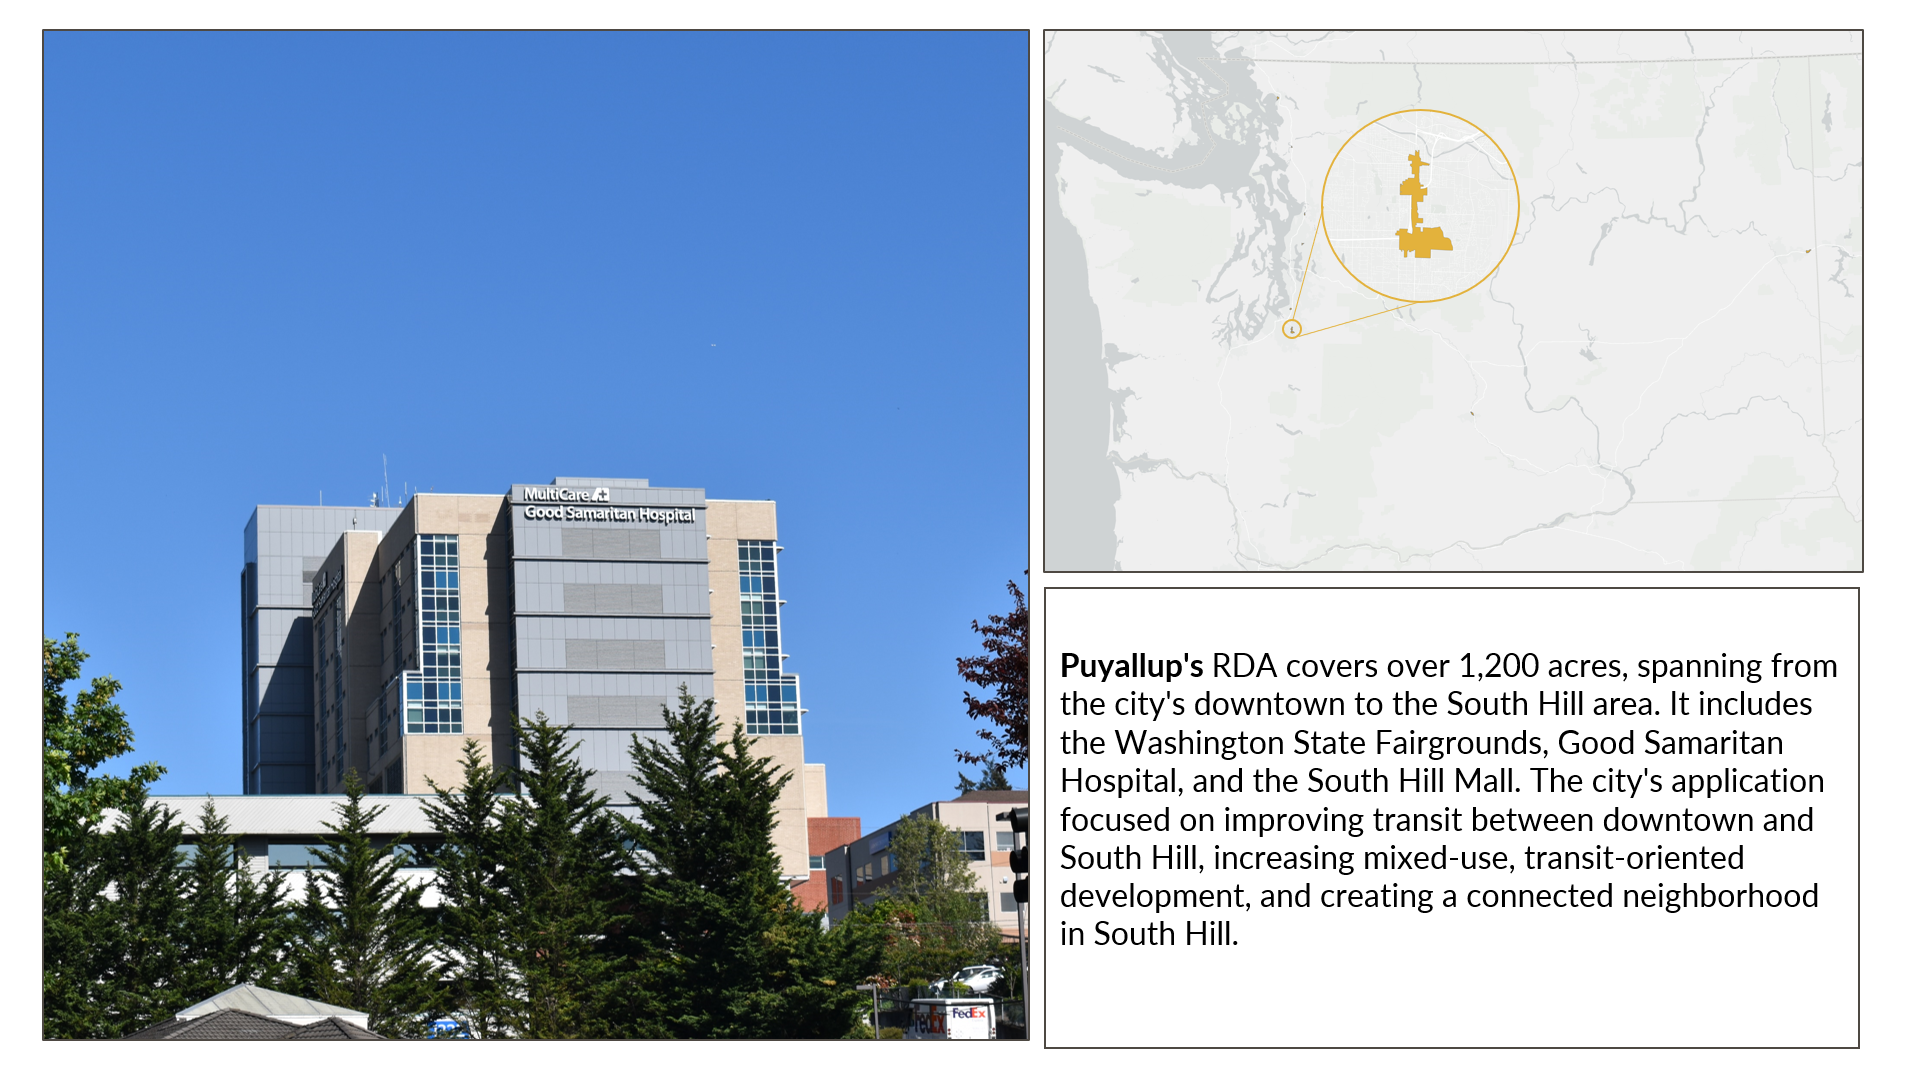
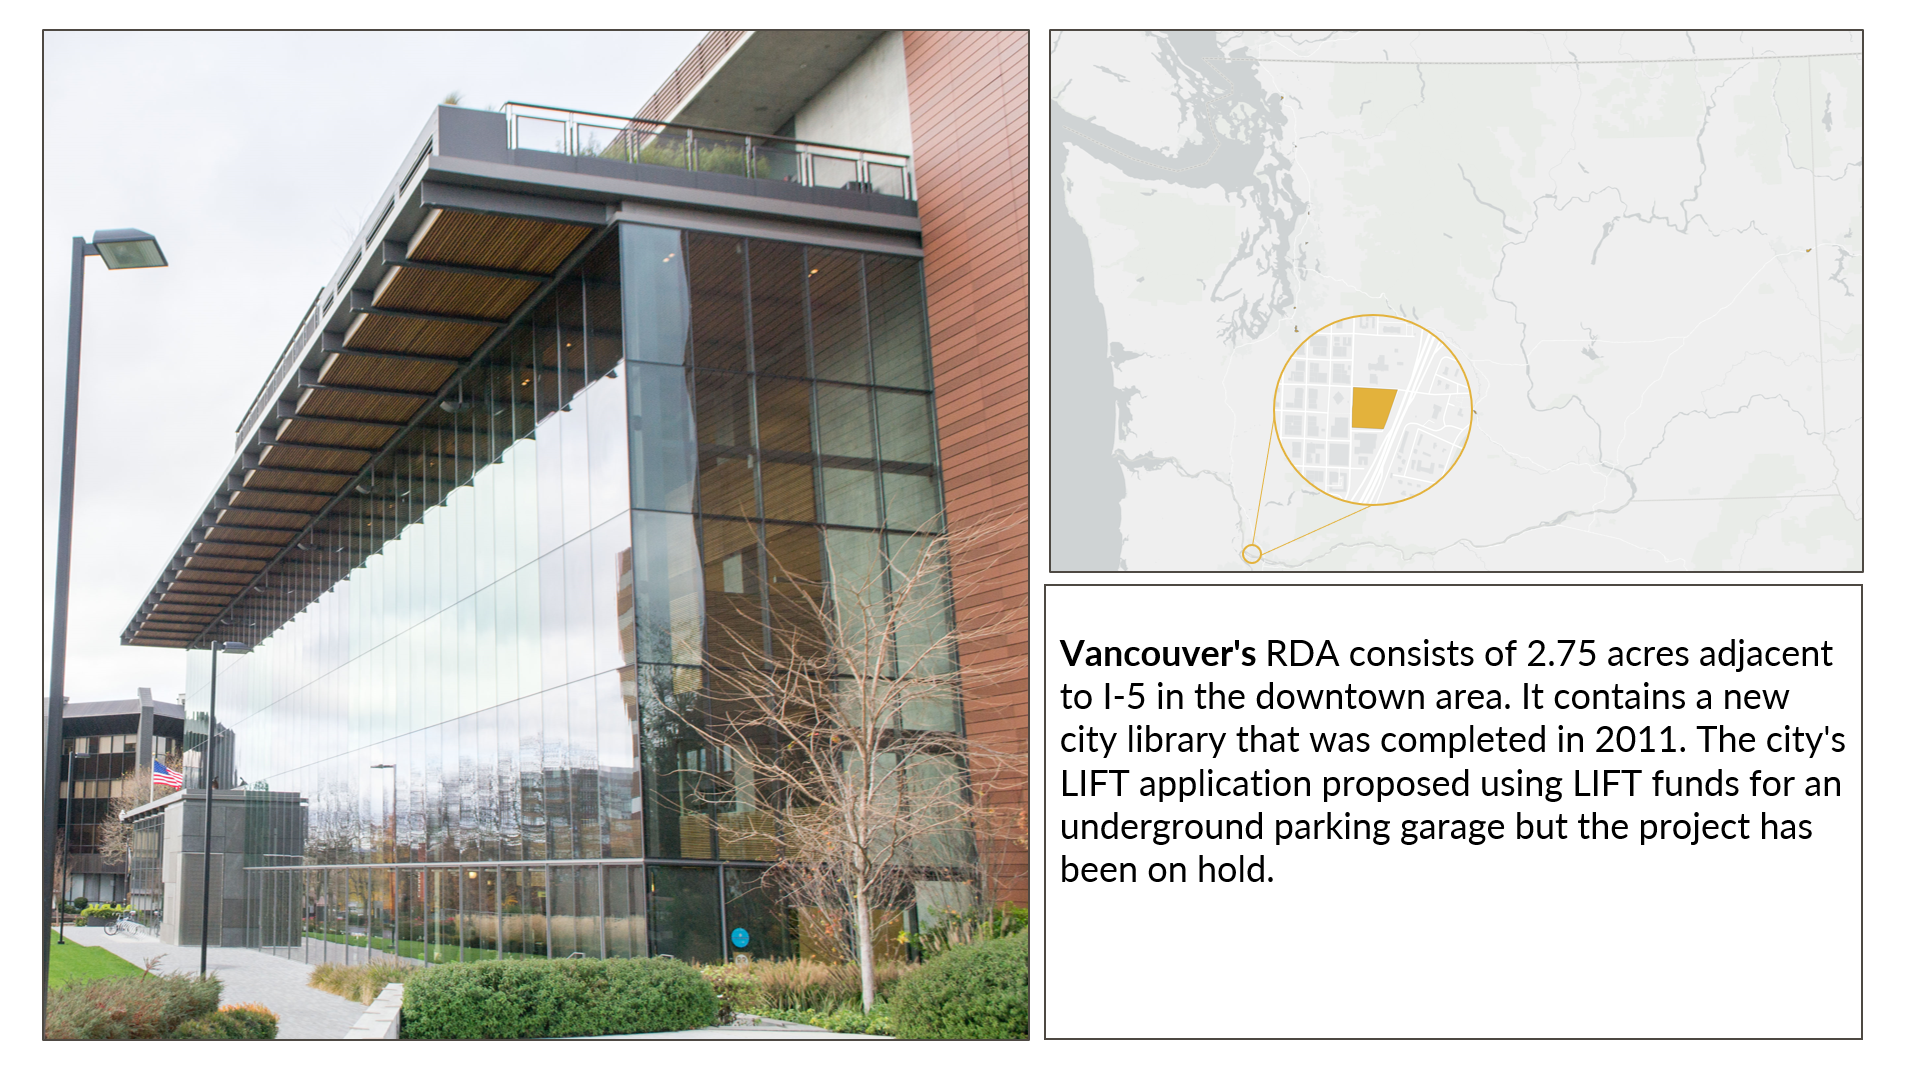
Through FY 2019, the state has contributed $41.4 million to infrastructure projects in participating cities: Bellingham, Bothell, Everett, Federal Way, Liberty Lake, Mount Vernon, Puyallup, Vancouver, and Yakima. Cities receive their state contribution by imposing a local sales and use tax (the "LIFT tax") that is credited against the state sales tax. Consumers do not see any increase in sales tax.
JLARC last evaluated LIFT in 2013. The 2013 report focused on the funding mechanism because most cities had not begun infrastructure improvements.

Five key economic indicators have increased in most Revenue Development Areas. It is unknown how much of the change is attributable to LIFT.
Taken together, economic activity in the eight active Revenue Development Areas (RDAs) Vancouver is not actively participating outpaced the cities' non-RDA areas between 2013 and 2018:
- Employment in the RDAs grew by 10.9% compared to 5.3% in the cities' non-RDA areas. Most new jobs (74%) were associated with accommodations, food services, health care, or social assistance.
- Wages grew by an average of $9,200 in the RDAs compared to $7,800 in the cities' non-RDA areas. The average wage in the RDAs ($44,600) is still lower than in the non-RDA areas ($58,100).
- Taxable sales in the RDAs grew by 39%, compared to 30% in the cities' non-RDA areas.
- New private construction made up 42% of the total assessed value of all property in the RDAs. In comparison, it was 14% of the assessed value of the cities' non-RDA areas.
- Property values in the RDAs increased by 97.1% compared to 56.2% in the cities' non-RDA areas.
Economic models estimate a range of short-term job impacts from LIFT-related construction
JLARC staff modeled three scenarios with different assumptions about the extent to which LIFT funding led to local public infrastructure investment. The results of the modeling show a range of potential impacts, depending on assumptions. There is no way to conclusively determine which—if any—of these scenarios is most accurate. Modeling long-term effects would require specific data about the characteristics of each LIFT infrastructure project (e.g., changes in traffic volume and accidents).
Given the challenges in attributing economic activity to LIFT, it is unlikely there will be sufficient evidence to recommend whether to expand the program to other cities
In 2028, JLARC must recommend whether LIFT should be expanded statewide and estimate the impact of an expansion on the state's economic development. It is unlikely there will be sufficient evidence to support a recommendation. Regardless, currently participating cities rely on LIFT funding.
Cities' reporting errors and a lack of state oversight led to potential excess payments and incomplete information for monitoring projects
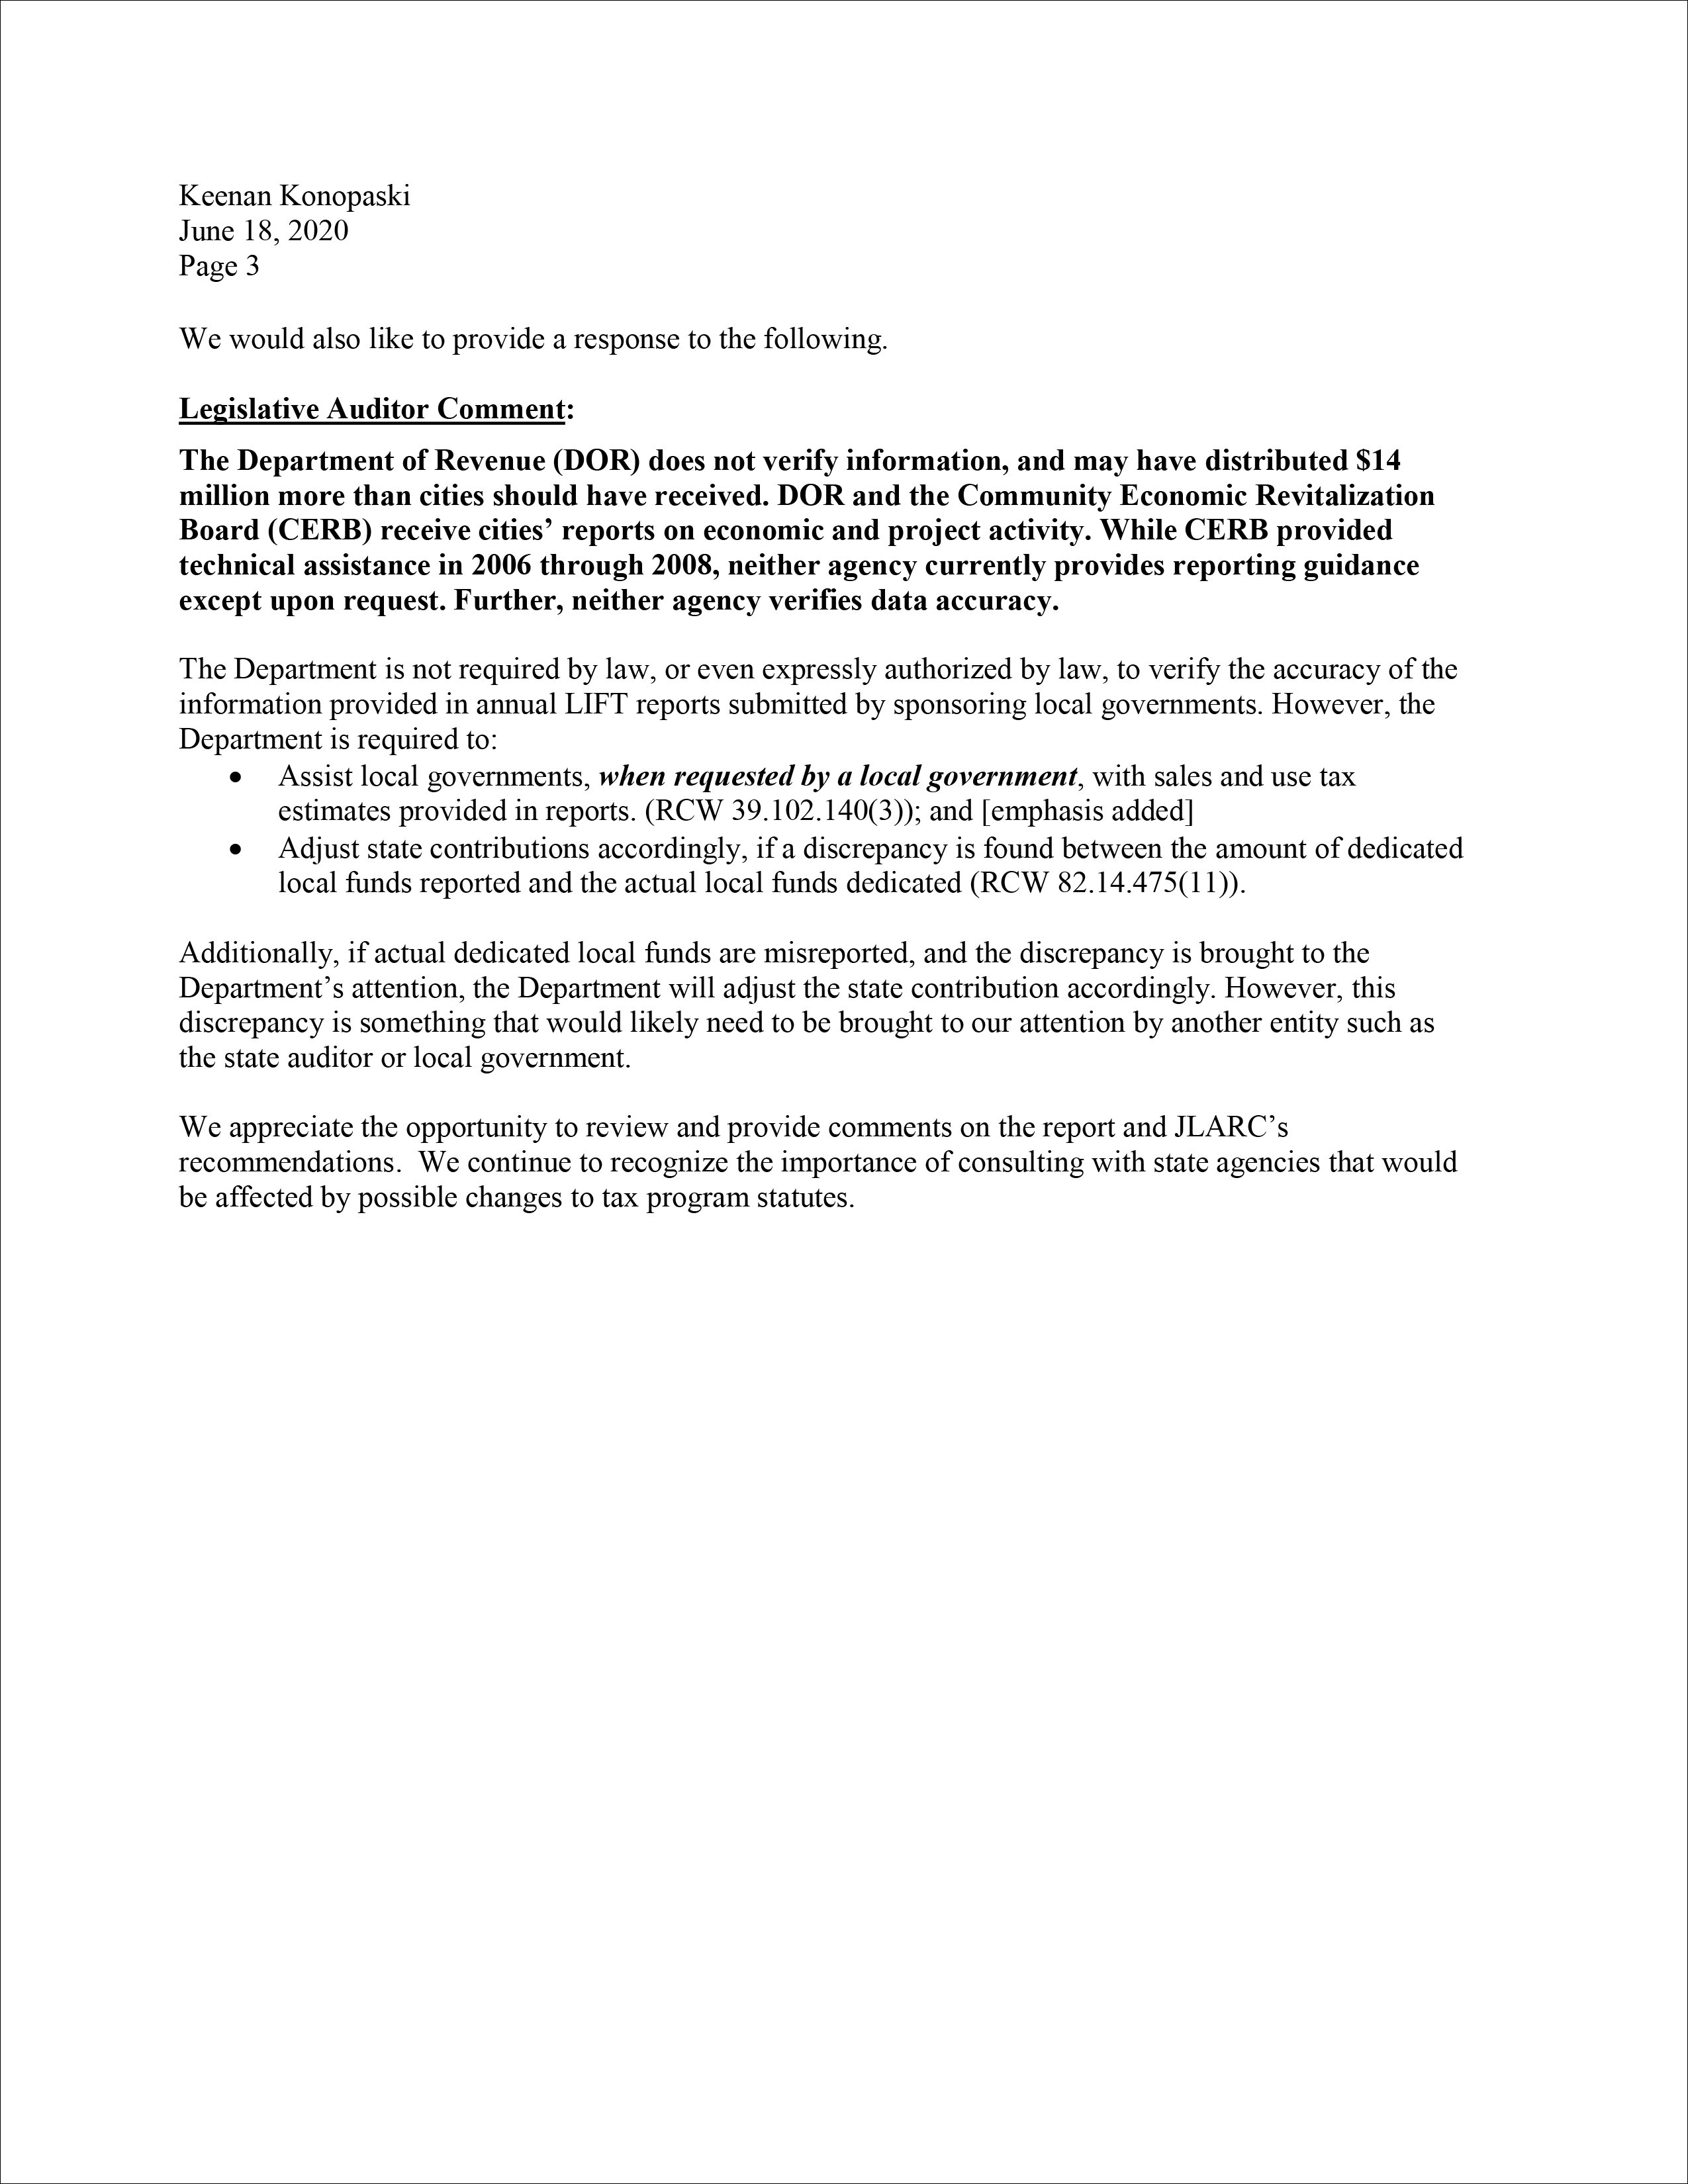
Cities have made errors in reporting, some of which may affect how the state contribution is calculated. The Department of Revenue (DOR) does not verify information, and may have distributed $14 million more than cities should have received. DOR and the Community Economic Revitalization Board (CERB) receive cities' reports on economic and project activity. While CERB provided technical assistance in 2006 through 2008, neither agency currently provides reporting guidance except upon request. Further, neither agency verifies data accuracy.
Legislative Auditor Recommendation
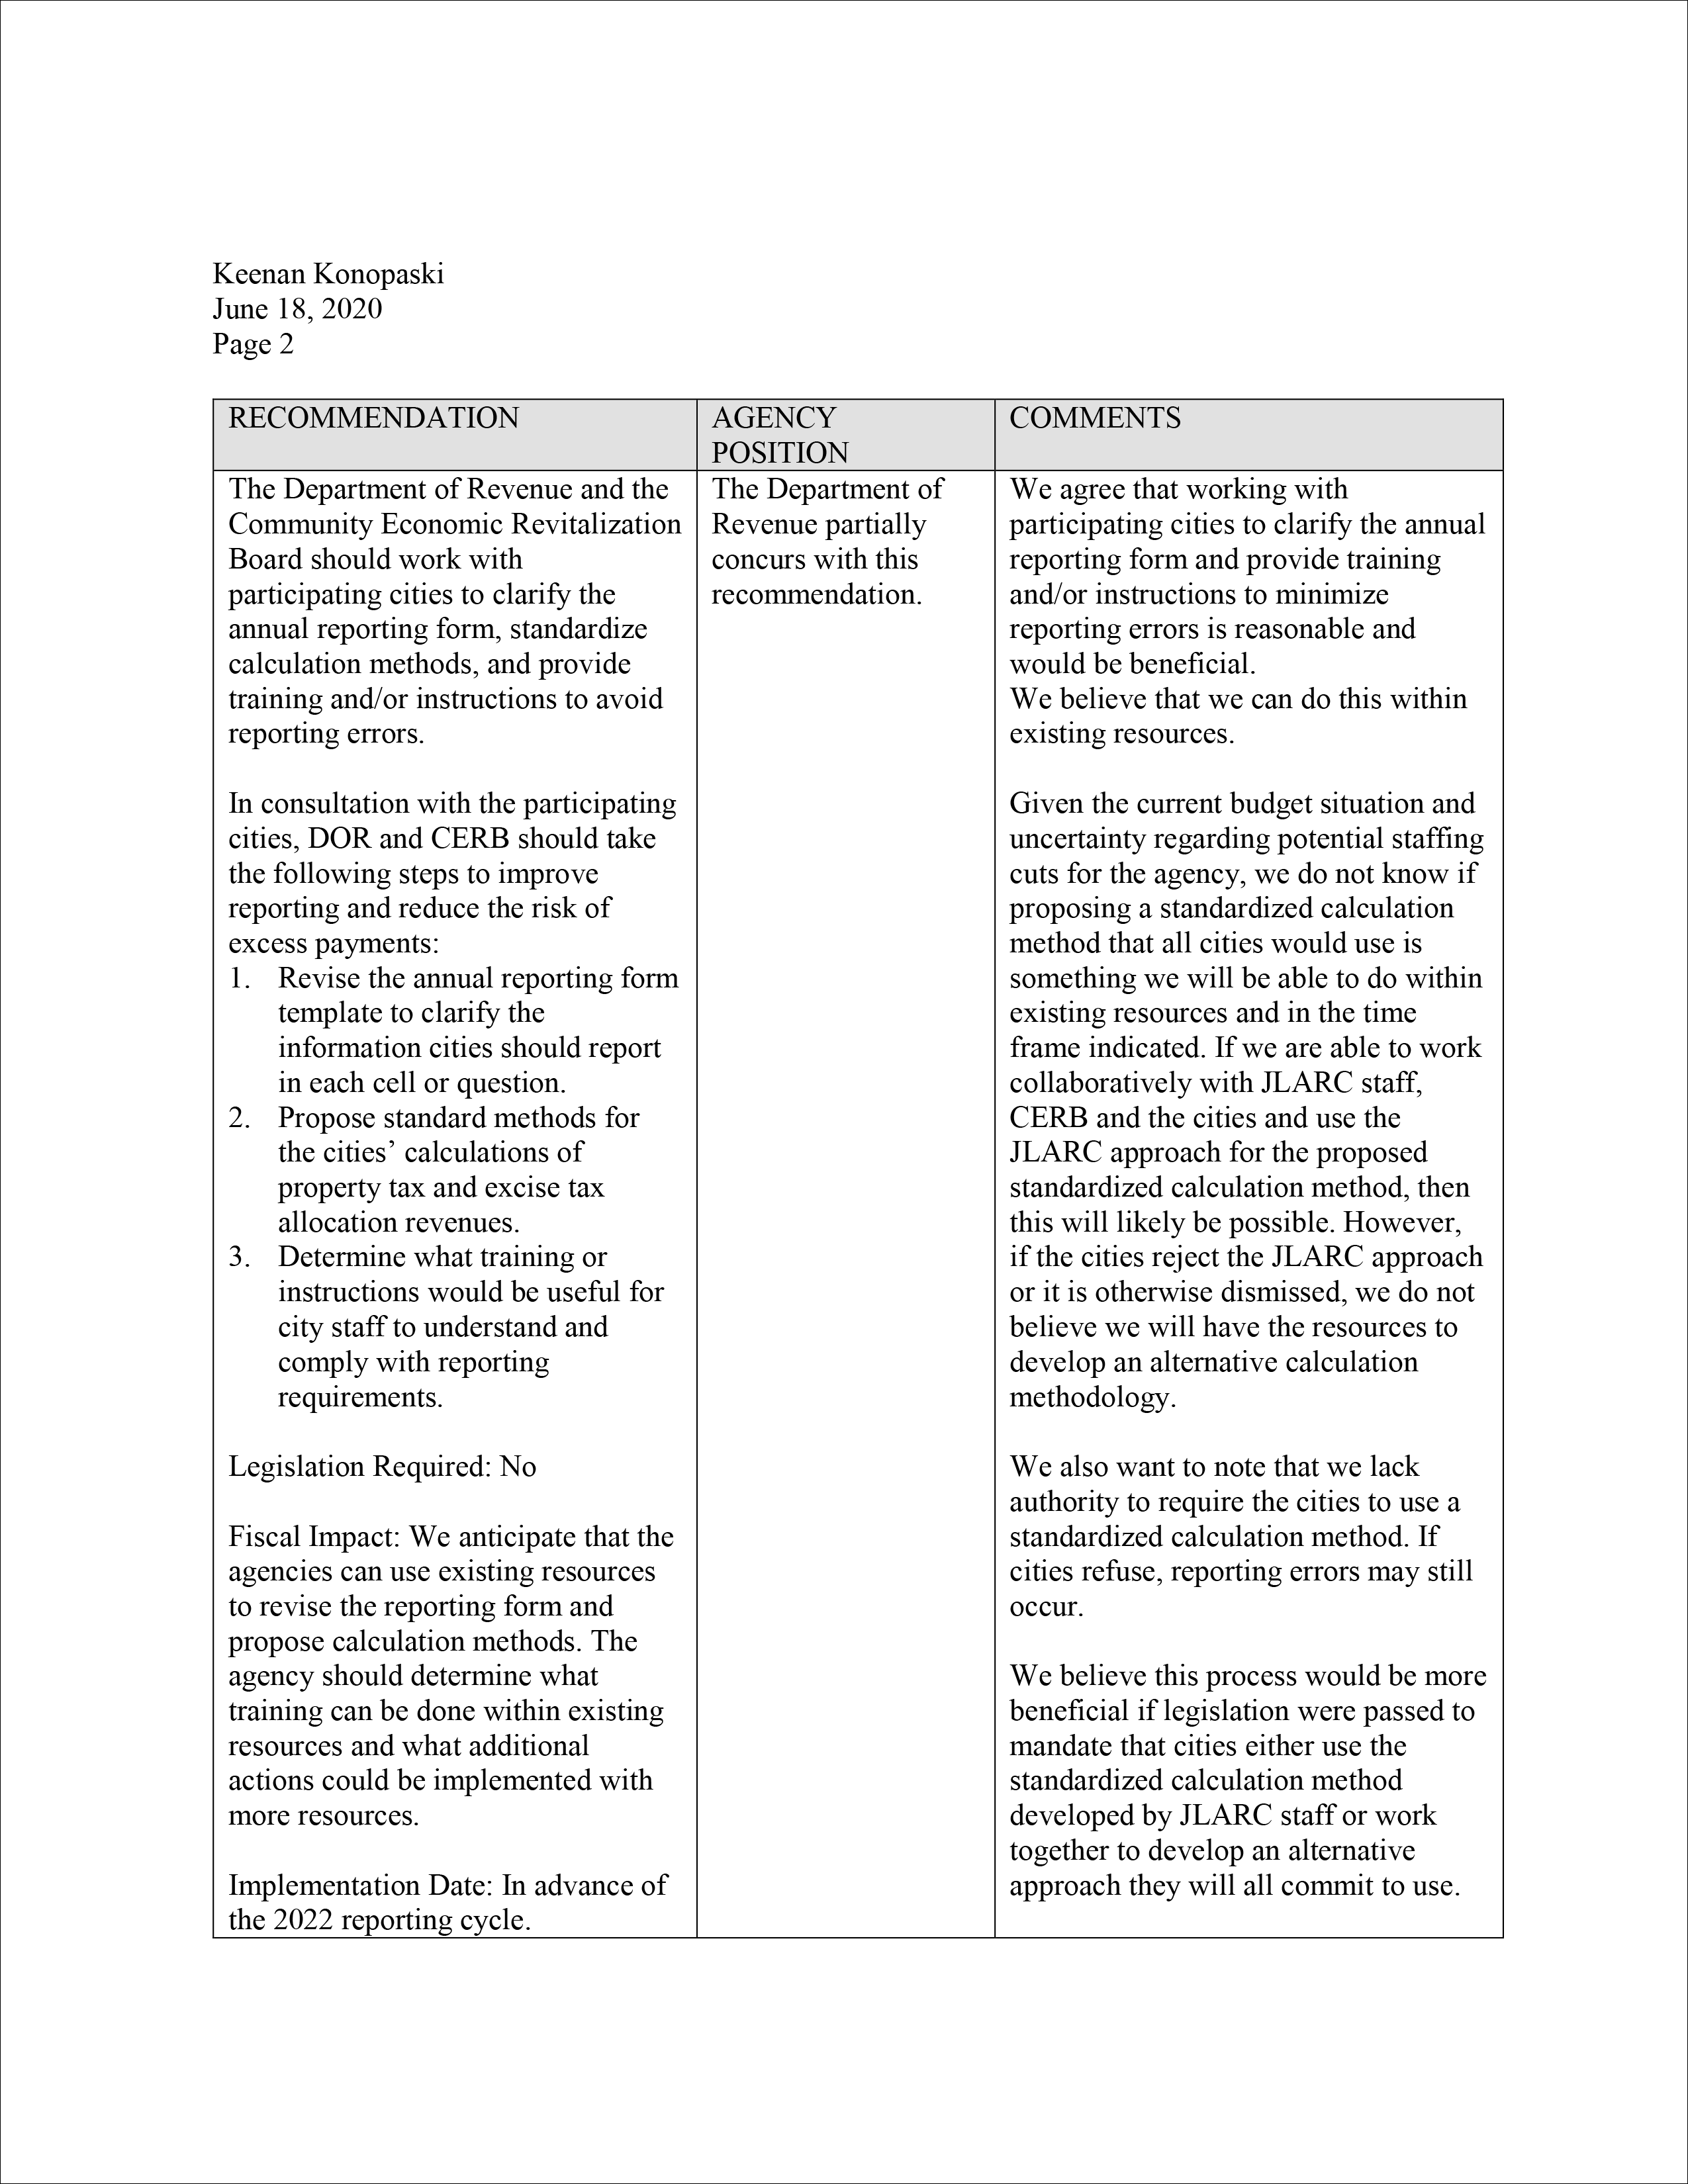
The Department of Revenue and the Community Economic Revitalization Board should work with participating cities to clarify the annual reporting form, standardize calculation methods, and provide training and/or instructions to avoid reporting errors.
The Department of Revenue and the Community Economic Revitalization Board partially concur with the recommendation. The Association of Washington Cities coordinated with nine impacted cities. As a collective they concur with the recommendation. In addition to this, we also received specific letters from the cities of Everett, Bothell, and Liberty Lake. You can find additional information on the Recommendations tab.
Committee Addendum
The Committee notes that when the program was created in 2006, the Legislature envisioned the need for continuing periodic reviews of the LIFT program by JLARC. The hope expressed in statute was for JLARC to identify evidence to determine what effect LIFT was having on economic measures.
The initial 2013 JLARC report found that insufficient data existed to accurately report on economic measures. The current report reached the same conclusion. It notes that while additional economic data is now available, there is no feasible method to determine whether or not LIFT had any influence on that data. JLARC staff consulted economic literature and economic development experts but did not find analytical methods using available data that could meet evidentiary standards required for an audit conclusion.
This Committee has authority under the budget act to adjust the work plan of the staff, including the ability to defer and delay evaluations. The Committee finds that future JLARC studies of LIFT are unlikely to yield new results and should be deferred unless the Committee receives renewed legislative requests. This would free up resources to pursue other audits and evaluations.
This decision does not in any way indicate any opposition to LIFT policies by the Committee, but rather an inability to determine to what extent these policies may be directly responsible for the economic growth that is occurring in cities with LIFT projects.
Committee Action to Distribute Report
On July 22, 2020 this report was approved for distribution by the Joint Legislative Audit and Review Committee. Action to distribute this report does not imply the Committee agrees or disagrees with Legislative Auditor recommendations.
 The Legislature designated
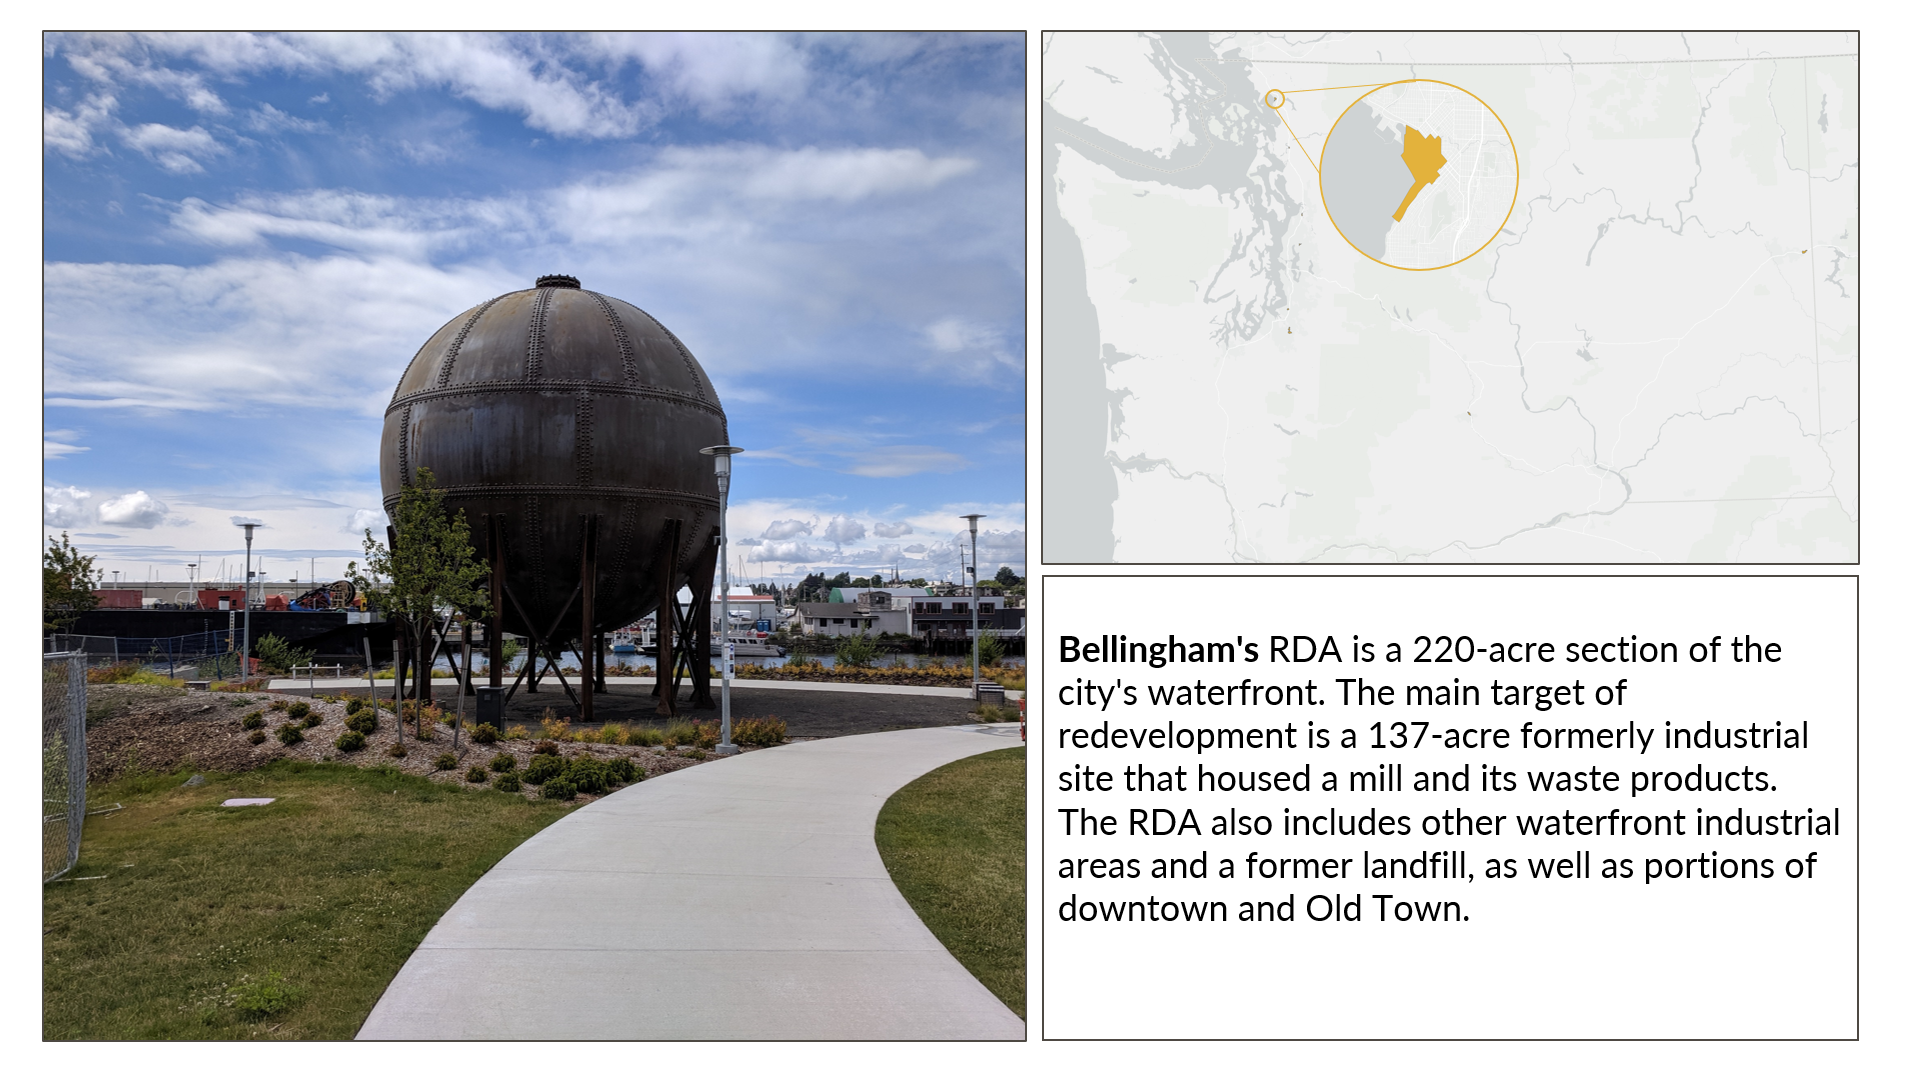

 JLARC staff analyzed employment data from the Employment Security
Department (ESD). Taken together, employment in seven of the active Revenue
Development Areas (RDAs) increased by 2,276 jobs (10.9%) from 2013 to 2018. If these
RDAs had grown at the same rate as the cities' non-RDA areas, they would have added
1,173 jobs — a difference of 1,103 fewer jobs. In Puyallup, the city's non-RDA areas
outperformed the RDA. If the Puyallup RDA had grown at the same rate as the non-RDA
areas, it would have added 2,801 jobs. Instead, it added 524.
JLARC staff analyzed employment data from the Employment Security
Department (ESD). Taken together, employment in seven of the active Revenue
Development Areas (RDAs) increased by 2,276 jobs (10.9%) from 2013 to 2018. If these
RDAs had grown at the same rate as the cities' non-RDA areas, they would have added
1,173 jobs — a difference of 1,103 fewer jobs. In Puyallup, the city's non-RDA areas
outperformed the RDA. If the Puyallup RDA had grown at the same rate as the non-RDA
areas, it would have added 2,801 jobs. Instead, it added 524.