

How Washington Compares: 2024
BRIEFING REPORT | APRIL 2024
Geneva Johnston, Data reporting
and visual communications analyst
Ryan McCord, Audit Director; Eric Thomas,
Legislative Auditor
Key points
JLARC staff prepared this reference guide for Washington legislators to compare Washington to other states in five categories:
- Population, economy, health, and environment
- Government spending and debt
- Education costs and spending
- Taxes and revenue
- Public assistance, transportation, and public safety spending
This report makes information from national datasets accessible and interactive.
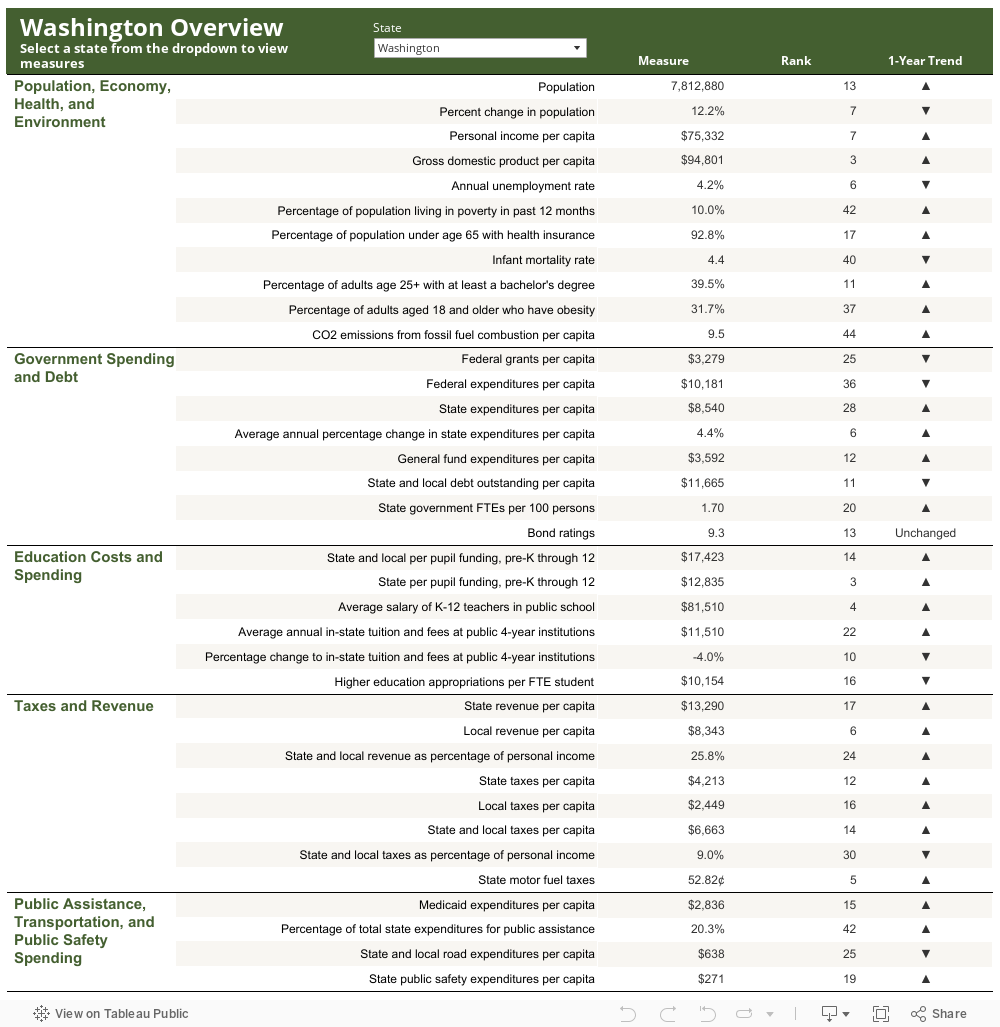
Overview of all measures
The table below shows the most current data for each of the 37 measures reported. Data sources and notes are below.
The 1-year trend arrow indicates whether the measure has increased or decreased from the previous year.
Data for all measures
You can view the data for all states and all measures by clicking the link below. The data includes the current and past five years of data for each state and the national average. For best results, view the data in full screen.

Data notes
- Data from prior years is not adjusted for inflation.
- The 50-state average shown in each table weights each state equally. It excludes the District of Columbia and Puerto Rico.
- Per capita amounts are calculated using mid-year population estimates from the U.S. Census Bureau.
- Tables are shaded to highlight the top 25% and bottom 25% for comparison.
-
In 2020, the U.S. Census Bureau did not release one-year estimates of the American Community Survey data because of the impact of COVID-19. The U.S. Census Bureau considers the 2020 data as experimental. This data is included in measures 6, 7, and 9.
Data sources
-
Population (2023)
Source: U.S. Census Bureau, Annual Estimates of the Resident Population
-
Percent change in population (2013-2023)
Source: U.S. Census Bureau, Annual Estimates of the Resident Population
-
Personal income per capita (2022)
Source: U.S. Bureau of Economic Analysis - Interactive data
Note: Personal income is income from net earnings, property, and transfer payments such as Social Security and unemployment benefits. Personal income includes contributions to government social insurance and excludes the deduction of personal taxes.
-
Gross domestic product per capita (2022)
Source: U.S. Bureau of Economic Analysis - Interactive data
Note: Gross domestic product by state is the sum of all value added by industries within a state.
-
Annual unemployment rate (2022)
Source: U.S. Bureau of Labor Statistics, Unemployment Rates for States, Annual Averages
Note: The unemployment rate is the percentage of people 16 years or older who did not have a job but were available for and have looked for work in the past four weeks.
-
Percentage of population living in poverty in past 12 months (2022)
Source: U.S. Census Bureau, Poverty Status in the Past 12 Months, American Community Survey 1-Year Estimates
In 2020, the U.S. Census Bureau did not release one-year estimates of the American Community Survey data because of the impact of COVID-19. The U.S. Census Bureau considers the 2020 data as experimental.
Note: Thresholds are updated annually for changes in the cost of living and do not vary across the U.S.
-
Percentage of population under age 65 with health insurance (2022)
Source: U.S. Census Bureau, Health Insurance Coverage in the United States
In 2020, the U.S. Census Bureau did not release one-year estimates of the American Community Survey data because of the impact of COVID-19. The U.S. Census Bureau considers the 2020 data as experimental.
Note: Health insurance is classified by the U.S. Census Bureau as insurance provided through an employer or a union, or purchased by an individual from a private company or government coverage. This includes Medicare, Medicaid, military health care, the Children's Health Insurance Program, and individual state health plans.
-
Infant mortality rate (2021)
Source: Centers for Disease Control and Prevention, National Center for Health Statistics, National Vital Statistics System, Linked Birth / Infant Death Records
Note: Infant mortality rate is the number of infant deaths before age one per 1,000 live births.
-
Percentage of adults age 25+ with at least a bachelor's degree (2022)
Source: U.S. Census Bureau, Educational Attainment, American Community Survey 1-Year Estimates
In 2020, the U.S. Census Bureau did not release one-year estimates of the American Community Survey data because of the impact of COVID-19. The U.S. Census Bureau considers the 2020 data as experimental.
-
Percentage of adults aged 18 and older who have obesity (2022)
Source: Centers for Disease Control and Prevention (CDC), Nutrition, Physical Activity, and Obesity: Data, Trends, and Maps, 2014-2022
-
CO2 emissions from fossil fuel combustion per capita (2021)
Source: Environmental Protection Agency (EPA), State Energy-Related Carbon Dioxide Emissions by Year, 1970-2021
-
Federal grants per capita (Federal FY22)
Source: USAspending.gov; U.S. Census Bureau, Annual Estimates of the Resident Population
Note: Federal grants are funds that are awarded to a non-federal entity for a defined public or private purpose in which services are not rendered to the federal government. Includes cooperative agreements.
-
Federal expenditures per capita (Federal FY22)
Source: USAspending.gov; U.S. Census Bureau, Annual Estimates of the Resident Population
Note: Federal expenditures in the state consist of contracts, grants, direct payments, federally funded insurance programs, loans/guarantees, and all other reimbursable, contingent, intangible, and indirect financial assistance. USAspending.gov data is complete for federal grants and contracts but not for the retirement benefits, non-retirement benefits, and salaries for federal employees. Therefore, data presented here does not include all federal spending in a state.
-
State expenditures per capita (FY22)
Source: National Association of State Budget Officers, State Expenditure Report; U.S. Census Bureau, Annual Estimates of the Resident Population
-
Average annual percentage change in state expenditures per capita (FY13-FY22)
Source: National Association of State Budget Officers, State Expenditure Report; U.S. Census Bureau, Annual Estimates of the Resident Population; U.S. Bureau of Labor Statistics, CPI Supplemental Files
Note: Figures in this comparison are adjusted for inflation and population growth over the FY08- FY17 period and include capital spending.
-
General fund expenditures per capita (FY22)
Source: National Association of State Budget Officers, State Expenditure Report; U.S. Census Bureau, Annual Estimates of the Resident Population
Note: The general fund, the predominant fund for financing state operations, receives revenues from broad-based state taxes. Specific functions are financed differently from state to state.
-
State and local debt outstanding per capita (FY21)
Source: U.S. Census Bureau, State and Local Government Finances by Level of Government and by State; Annual Estimates of the Resident Population
-
State government FTEs per 100 persons (2022)
Source: U.S. Census Bureau, Census of Governments: Employment; Annual Estimates of the Resident Population
Note: The full-time equivalent (FTE) calculation incorporates the hours of both full- and part-time employees. Total part-time hours are apportioned as though they had been worked by full-time employees.
-
Bond ratings (December 2023)
Source: Washington State Treasurer's Office, State General Obligation Bond Ratings
Note: States are ranked based on the average value of their bond ratings on a 10-point scale, with AAA rating equal to 10 points. For states with no general obligation debt, the data shows the rates they would likely receive if they did issue general obligation debt.
-
State and local per pupil funding, pre-K through 12 (School year 2020-21)
Source: U.S. Census Bureau, Census of Governments: Public Education Finances
Note: Excludes revenue from and payments to other school systems. Excludes expenditures for adult education, community services, and other non-elementary and secondary programs. Includes the finances of charter schools whose charters are held directly by a government or a government agency.
-
State per pupil funding pre-K through 12 (School year 2020-21)
Source: U.S. Census Bureau, Census of Governments: Public Education Finances
Note: Excludes revenue from and payments to other school systems. Excludes expenditures for adult education, community services, and other non-elementary and secondary programs. Includes the finances of charter schools whose charters are held directly by a government or a government agency.
-
Average salary of K-12 teachers in public school (School year 2021-22)
Source: National Education Association, Ranking & Estimates: Rankings of the States and Estimates of School Statistics
-
Average annual in-state tuition and fees at public 4-year institutions (School year 2023-24)
Source: College Board, Trends in College Pricing
Note: Excludes room and board.
-
Percentage change to in-state tuition and fees at public 4-year institutions (School years 2018-19 to 2023-24)
Source: College Board, Trends in College Pricing
Note: College Board uses the Consumer Price Index, All Urban Consumers to adjust for inflation.
-
Higher education appropriations per FTE student (FY22)
Source: State Higher Education Executive Officers Association, State Higher Education Finance Report
Note: Includes appropriations for state-supported community colleges, 2-year colleges, and public undergraduate and graduate programs. Education appropriations include state and local support for public higher education operating expenses, including Recovery Act funds, and exclude appropriations for independent institutions, financial aid for students attending independent institutions, research, hospitals, and medical education. Full-time equivalent enrollment equates student credit hours to fulltime academic year students and excludes medical students.
-
State revenue per capita (FY21)
Source: U.S. Census Bureau, State and Local Government Finances by Level of Government and by State; Annual Estimates of the Resident Population.
-
Local revenue per capita (FY21)
Source: U.S. Census Bureau, State and Local Government Finances by Level of Government and by State; Annual Estimates of the Resident Population
-
State and local revenue as percentage of personal income (FY21)
Source: U.S. Census Bureau, State and Local Government Finances by Level of Government and by State; U.S. Bureau of Economic Analysis - Interactive data
-
State taxes per capita (FY21)
Source: U.S. Census Bureau, State and Local Government Finances by Level of Government and by State; Annual Estimates of the Resident Population
-
Local taxes per capita (FY21)
Source: U.S. Census Bureau, State and Local Government Finances by Level of Government and by State; Annual Estimates of the Resident Population
-
State and local taxes per capita (FY21)
Source: U.S. Census Bureau, State and Local Government Finances by Level of Government and by State; Annual Estimates of the Resident Population
-
State and local taxes as percentage of personal income (FY21)
Source: U.S. Census Bureau, State and Local Government Finances by Level of Government and by State; U.S. Bureau of Economic Analysis - Interactive data
-
State motor fuel taxes (2023)
Source: U.S. Energy Information Administration, Federal and State Motor Fuel Taxes Report; Washington State Department of Revenue, Motor Vehicle Fuel Tax Rates
-
Medicaid expenditures per capita (Federal FY22)
Source: Kaiser Family Foundation, State Health Facts: Total Medicaid Spending; U.S. Census Bureau, Annual Estimates of the Resident Population
Note: Does not include administrative costs or accounting adjustments.
-
Percentage of total state expenditures for public assistance (FY21)
Source: U.S. Census Bureau, State and Local Government Finances by Level of Government and by State; Annual Estimates of the Resident Population
-
State and local road expenditures per capita (FY21)
Source: U.S. Census Bureau, State and Local Government Finances by Level of Government and by State; Annual Estimates of the Resident Population; U.S. Federal Highway Administration: Highway Statistics
Note: Road expenditures include maintenance, operation, repair, and construction of highways, streets, and roads; and capital expenditure for purchase or construction.
-
State public safety expenditures per capita (FY21)
Source: U.S. Census Bureau, State and Local Government Finances by Level of Government and by State; Annual Estimates of the Resident Population
JLARC members on publication date
The Joint Legislative Audit and Review Committee (JLARC) works to make state government operations more efficient and effective. The Committee includes an equal number of House members and Senators, Democrats and Republicans.
JLARC's nonpartisan staff completed this data compilation under direction of the Legislative Auditor.
SenatorsBob Hasegawa Liz Lovelett Mark Mullet, Chair Ann Rivers Jesse Salomon Shelly Short Lynda Wilson, Secretary Keith Wagoner |
RepresentativesEmily Alvarado Stephanie Barnard April Berg Jake Fey Keith Goehner Stephanie McClintock Ed Orcutt, Vice Chair Gerry Pollet, Assistant Secretary |