
JLARC compilation of municipal reports

- About the Report
- Statewide Summary
- Municipal Summary
- Activity-Specific Data
- Reporting Compliance
- Download the Data
Report presents data from municipalities about use of lodging tax revenue
This report summarizes data for calendar years 2014 through 2016, as reported by cities, towns, and counties that received a distribution of lodging tax revenue.
JLARC compiles but does not verify expenditure reports from municipalities
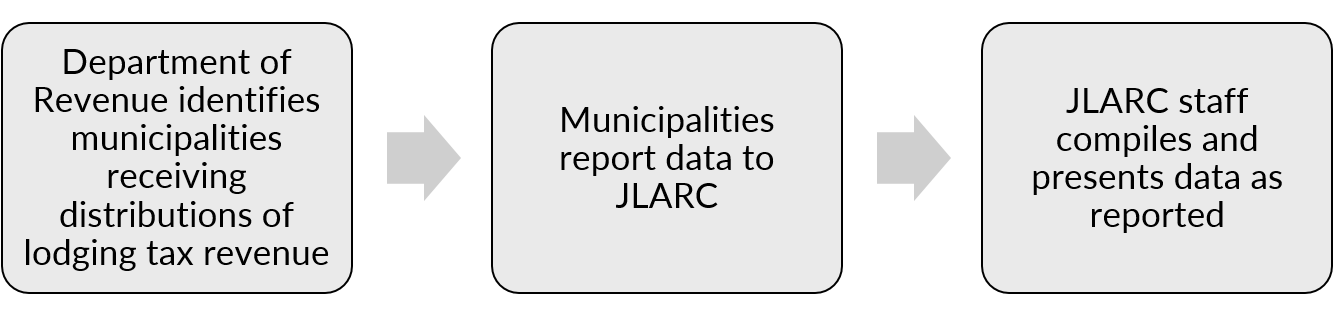
In 2013, the Legislature directed the Joint Legislative Audit and Review Committee (JLARC) to collect and report local use of lodging tax revenues for tourism purposes (ESHB 1253).
JLARC staff establishes a reporting system, provides reporting guidelines, and compiles the reports each year. Municipalities are responsible for the accuracy of their data, and JLARC staff do not independently verify the information.
Municipalities collect and use lodging tax revenues for tourism activities
Municipalities (cities, towns, and counties) may levy sales taxes on lodging in two ways:
- Collect a lodging tax of up to 2 percent that is taken as a credit against the state sales tax due on lodging.
- Collect an additional sales tax of up to 2 percent on lodging stays.
Municipalities may use lodging tax revenues for these activities:
- Tourism marketing,
- Operations of special events and festivals designed to attract tourists, and
- Capital expenditures for tourism-related facilities owned by the municipality.
The municipality may spend the funds directly or award the funds to a convention and visitors bureau or destination marketing organization. With the exception of King County, any municipality that receives a distribution of lodging tax revenue must report information to JLARC (RCW 67.28.1816).
Questions about the reported information should be directed to the individual municipality. To learn more about the reporting process, please visit JLARC's Lodging Tax Data Collection page.
98% of municipalities reported in 2016
The Department of Revenue identified 202 municipalities that received a distribution of lodging tax revenue in 2016. Of these, 198 (98 percent) reported information to JLARC. The Reporting Compliance tab includes more details.
|
2014 |
2015 |
2016 |
|---|---|---|---|
Received funds (report required) |
195 |
195 |
202 |
Reported lodging tax expenditures |
152 |
180 |
184 |
Reported no expenditures |
13 |
12 |
14 |
Did not report |
30 |
3 |
4 |
Statewide: Municipalities report $48 million awarded, 54.6 million attendees, 8.1 million paid lodging nights
The following table summarizes the data statewide. You can find additional detail on the Municipal Summaries and Activity-Specific Data tabs. Our glossary defines each term.
|
2014 |
2015 |
2016 |
|---|---|---|---|
Funding |
|||
Funds requested for activities |
$57,418,410 |
$44,201,383 |
$48,091,969 |
Funds awarded by municipalities |
$37,134,016 |
$40,413,415 |
$45,267,335 |
Total activity cost (including other funds) |
$142,352,632 |
$147,828,485 |
$161,219,869 |
Attendance at activities funded by lodging tax revenue (actual) |
|||
Overall attendance |
35,425,504 |
54,877,411 |
54,653,511 |
Attendees who traveled 50+ miles |
17,627,699 |
24,353,595 |
23,170,603 |
Attendees from out of state or country |
5,150,003 |
8,765,332 |
8,648,488 |
Lodging |
|||
Paid lodging nights |
7,015,259 |
6,995,235 |
8,131,175 |
Attendees who did not pay for overnight lodging |
4,327,691 |
9,852,330 |
13,317,114 |
Attendees who paid for overnight lodging |
8,858,370 |
10,234,630 |
12,400,872 |
Note: Municipalities did not always report overnight attendance data to JLARC so overall attendance may exceed the lodging attendance.
Source: Reports provided by municipalities that received a distribution of lodging tax revenue during 2014 - 2016, as identified by the Department of Revenue. Statute exempts King County from the reporting requirement. Some municipalities did not spend lodging tax revenues or submit reports. JLARC staff report but do not verify the information.
View each municipalities’ annual funding, attendance, and lodging data
This table presents annual totals for activities funded by lodging tax revenues in each municipality. Data includes projected and actual figures for attendance and lodging nights.
- Scroll the spreadsheet window to the right to view all data columns. Our glossary defines each term.
- Use the buttons on the left or the column filter to filter data by year, activity type, and municipality.
- Highlighted fields indicate that the municipality did not report data.
If you choose “activity type,” the table will show the totals for all activities within the type. You can find data about individual activities (e.g., a community festival) on the Activity-Specific Data tab.
View the funding, attendance, and lodging data for each activity
This table provides funding, attendance, and lodging data for over 4,000 discrete activities funded by lodging tax revenues.
- Scroll the spreadsheet window to the right to view all data columns. Our glossary defines each term.
- Use the buttons on the left or the column filter to filter data by year, activity type, and municipality.
- Highlighted fields indicate that the municipality did not report data.
Reporting is required by state law
RCW 67.28.1816 requires local governments to report expenditures of lodging tax revenue. Statute exempts King County from the reporting requirement.
JLARC staff summarized compliance into four categories:
- Reported no expenditures: the municipality received a distribution of lodging tax revenue and reported to JLARC that they did not expend any lodging tax revenue.
- Reported: the municipality reported lodging tax expenditures to JLARC.
- No state distribution: the municipality did not receive lodging tax revenues during this year and did not report expenditures to JLARC.
- Did not report: The municipality received a distribution of lodging tax revenue during the year but failed to report expenditures to JLARC.
Use the buttons on the left or the column filters to filter data by year and municipality.
You can view or save the data
The Excel files linked below contain complete lodging tax data reported to JLARC for 2014 - 2016.
To download the data, click the Save As button and save to your computer.
Please note that JLARC staff do not independently verify the data in these files.
Blank fields indicate that the municipality did not report data.