JLARC Preliminary Report: Economic Impact of Public Lands
Legislative Auditor’s Conclusion:
County economies are influenced more by the way that the land is used than by the amount of public land in a county
- Results what we learned
- Report details
- Response from agencies
- More about the study
- View/Print entire report
At the direction of the Legislature, JLARC staff worked with a team of economists from Washington State University to evaluate whether a higher percentage of state and federal natural resource lands is detrimental to measures of economic vitality in a county.
The results of this study indicate that, in general, the percentage of public lands did not negatively affect county economic growth over a 20-year period (1990-2010). This finding is consistent with recent academic research about the impact of public lands.
While the overall percentage of public lands within counties does not appear to negatively affect their economies, specific sites may have positive or negative net impacts on local jobs and business output. Impacts are driven in large part by how the land is used, regardless of ownership.
Estimating the impacts of public land is highly dependent on the data available, the assumptions made, and whether or not land use at a specific site has changed enough to cause a measurable change in the economy. Individual acquisitions may not result in enough land use change to estimate impacts.
Economic impact analyses can inform decisions about public lands but may not capture broader impacts. A county-level analysis may not identify the impacts to other counties or the state. These analyses may not account for non-economic policy-related goals (e.g., providing habitat for plant or animal species).
- In Brief
- Amount of Public Land Varies
- Generally, No Negative Effect
- Specific Sites May Have Impacts
- Lessons Learned
- Technical Appendix: Regression Analysis
- Technical Appendix: Economic Impact Case Studies
JLARC staff worked with economists from WSU to evaluate the hypothesis that higher percentages of acres of public lands are detrimental to measures of economic vitality in a county
A team of economists from Washington State University (WSU) used regression analysis and case studies to gain insights into what might affect measures of county economic vitality. Their work indicates:
- There is wide variation across the counties in the amount of natural resource land owned by state and federal agencies.
- While the overall percentage of public natural resource lands within counties does not appear to negatively affect local economies, specific sites may have positive or negative net impacts on local jobs and business output.
- Impacts are driven in large part by how the land is used. Estimating these impacts will be highly dependent on the data available, the assumptions made, and whether or not land use at a specific site has changed enough to cause a measurable change in the economy. Individual acquisitions may not result in enough land use change to estimate impacts.
- Economic impact analyses can inform decisions about public lands but may not capture broader impacts. A county-level analysis may not identify the impacts to other counties or the state. Also, these analyses may not account for non-economic goals such as habitat preservation.
There is wide variation across the counties in the amount of natural resource land owned by state and federal agencies
The percent of public natural resource lands in Washington counties ranges from 3 percent to 89 percent (Exhibit 1). Statewide, these lands account for 37 percent of all acreage (9 percent is state owned, 28 percent is federally owned). Federal ownership exceeds state ownership in 25 counties (Exhibit 2).
- This data is based on WSU analysis of the land inventory done by the Recreation and Conservation Office (RCO) in July 2014.
This study defines public lands as state and federal recreation, habitat, conservation, and trust land. These lands include:
- Properties owned by three state agencies: State Parks (Parks), the Department of Natural Resources (DNR), and the Department of Fish and Wildlife (WDFW).
- State trust lands managed by DNR.
- Properties owned by four federal agencies: the National Park Service, the U.S. Forest Service, the U.S. Fish and Wildlife Service, and the Bureau of Land Management.
RCO was unable to collect accurate information about local and tribal natural resource lands so those lands are excluded from this study.
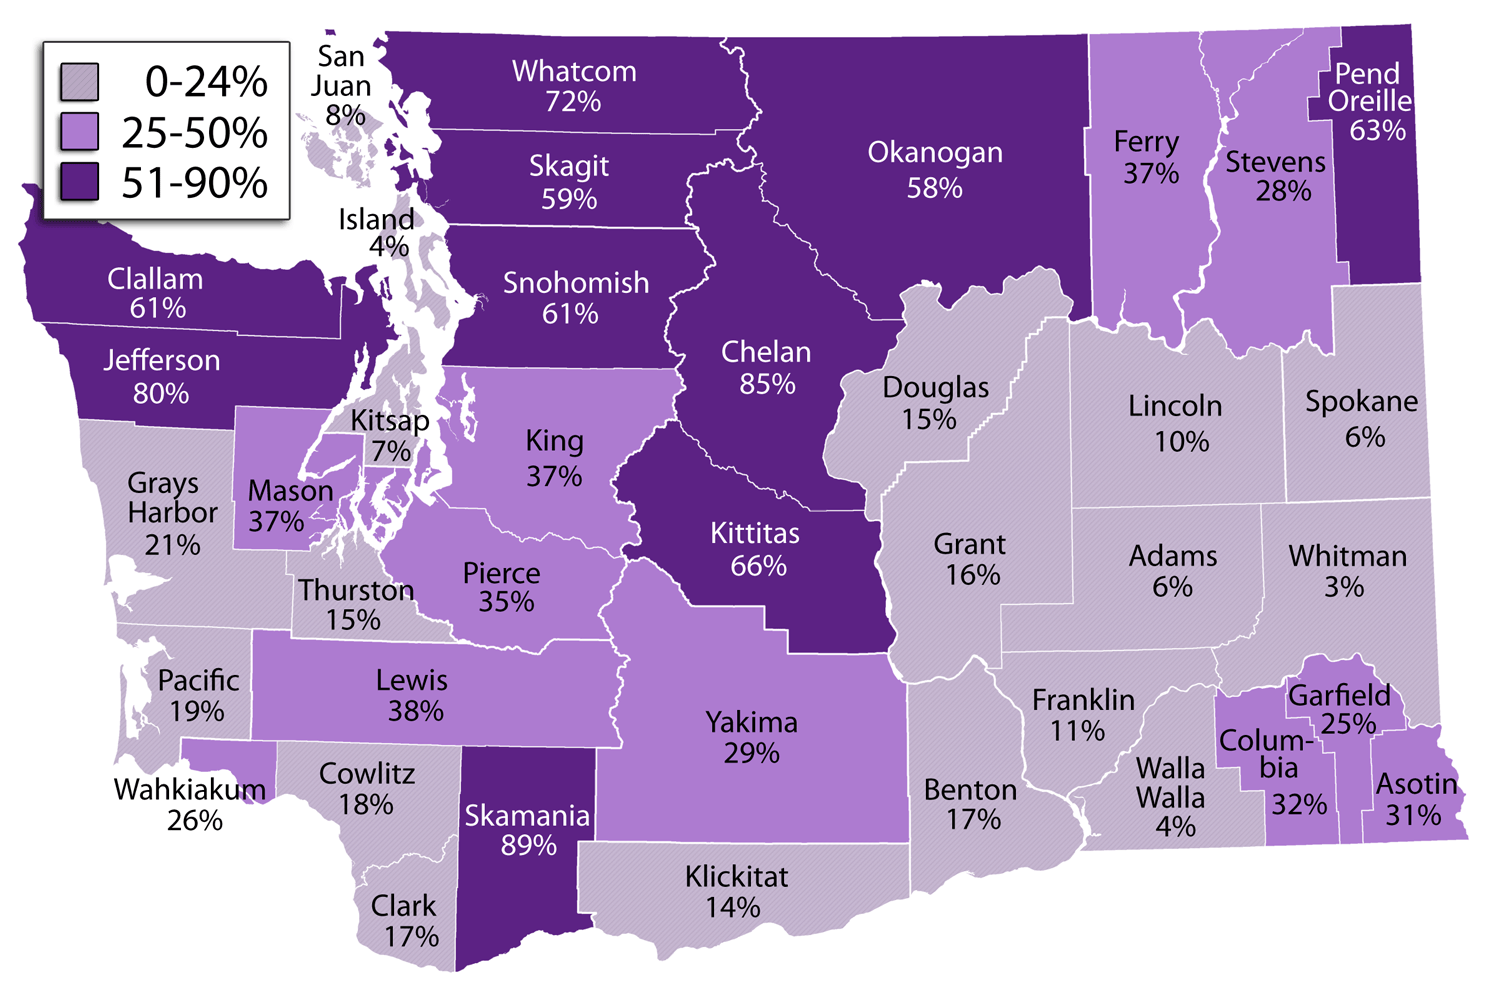
| County | State & Federal Land Combined |
State Owned Land |
Federal Owned Land |
|||
|---|---|---|---|---|---|---|
| Acres | Percent | Acres | Percent | Acres | Percent | |
| Adams | 76,991 | 6% | 55,466 | 5% | 21,525 | 2% |
| Asotin | 126,504 | 31% | 59,084 | 15% | 67,420 | 17% |
| Benton | 184,386 | 17% | 54,673 | 5% | 129,713 | 12% |
| Chelan | 1,580,461 | 85% | 64,070 | 3% | 1,516,391 | 81% |
| Clallam | 679,222 | 61% | 166,652 | 15% | 512,570 | 46% |
| Clark | 68,932 | 17% | 61,259 | 15% | 7,673 | 2% |
| Columbia | 180,646 | 32% | 21,102 | 4% | 159,544 | 29% |
| Cowlitz | 129,025 | 18% | 94,117 | 13% | 34,908 | 5% |
| Douglas | 171,840 | 15% | 117,988 | 10% | 53,851 | 5% |
| Ferry | 518,034 | 37% | 32,836 | 2% | 485,198 | 34% |
| Franklin | 85,020 | 11% | 35,573 | 4% | 49,447 | 6% |
| Garfield | 113,735 | 25% | 18,260 | 4% | 95,475 | 21% |
| Grant | 282,213 | 16% | 135,882 | 8% | 146,331 | 9% |
| Grays Harbor | 250,199 | 21% | 97,149 | 8% | 153,050 | 13% |
| Island | 5,659 | 4% | 5,586 | 4% | 73 | 0% |
| Jefferson | 917,752 | 80% | 214,472 | 19% | 703,279 | 61% |
| King | 502,061 | 37% | 135,898 | 10% | 366,163 | 27% |
| Kitsap | 17,543 | 7% | 17,535 | 7% | 8 | 0% |
| Kittitas | 973,929 | 66% | 478,997 | 33% | 494,931 | 34% |
| Klickitat | 164,959 | 14% | 122,491 | 10% | 42,468 | 4% |
| Lewis | 581,033 | 38% | 100,577 | 7% | 480,457 | 31% |
| Lincoln | 143,591 | 10% | 65,036 | 4% | 78,555 | 5% |
| Mason | 227,891 | 37% | 61,962 | 10% | 165,929 | 27% |
| Okanogan | 1,966,580 | 58% | 397,635 | 12% | 1,568,945 | 47% |
| Pacific | 113,418 | 19% | 97,005 | 16% | 16,413 | 3% |
| Pend Oreille | 563,714 | 63% | 33,510 | 4% | 530,204 | 59% |
| Pierce | 372,586 | 35% | 39,715 | 4% | 332,871 | 31% |
| San Juan | 9,118 | 8% | 7,792 | 7% | 1,326 | 1% |
| Skagit | 657,206 | 59% | 154,261 | 14% | 502,944 | 45% |
| Skamania | 941,107 | 89% | 94,095 | 9% | 847,012 | 80% |
| Snohomish | 810,011 | 61% | 171,936 | 13% | 638,074 | 48% |
| Spokane | 65,397 | 6% | 46,200 | 4% | 19,197 | 2% |
| Stevens | 445,316 | 28% | 162,074 | 10% | 283,242 | 18% |
| Thurston | 71,014 | 15% | 66,862 | 14% | 4,152 | 1% |
| Wahkiakum | 43,457 | 26% | 40,516 | 24% | 2,940 | 2% |
| Walla Walla | 35,986 | 4% | 19,049 | 2% | 16,937 | 2% |
| Whatcom | 964,943 | 72% | 93,824 | 7% | 871,120 | 65% |
| Whitman | 44,698 | 3% | 35,465 | 3% | 9,233 | 1% |
| Yakima | 807,757 | 29% | 271,337 | 10% | 536,420 | 20% |
Note: Percent state and federal land may not add to total due to rounding.
Source: WSU analysis of data provided by the Recreation and Conservation Office, July 2014. Federal counts include the acreage identified by WSU economists as providing natural-resource related habitat, recreation, conservation, or revenue generation.
In general, the percentage of public natural resource lands in Washington counties did not negatively affect job, income, or population growth between 1990 and 2010
Economists from Washington State University (WSU) conducted a regression analysis of Washington’s 39 counties. Regression analysis is a statistical process that estimates the relationships between a factor and an outcome while controlling for other factors. (Learn more in Technical Appendix.)
Overall percent of public natural resource land is not a major driver of county job, income, and population growth
The economists analyzed the relationship between the percent of public lands in each county and job, income, and population growth.
- For this study, public lands are defined as state and federal recreation, habitat, conservation, and trust lands.
- The analysis focused on job, income, and population growth because these are common measures of economic vitality in the academic literature.
- The economists looked at percent change in job, income, and net population between 1990-2000 and between 2000-2010 for each county in Washington. This approach captures periods of economic growth and decline.
The analysis found no strong relationship between the percent of public lands and these county economic vitality measures.
- This means that a change in the percentage of publicly owned land in a county is not expected to strongly affect county economic vitality in a positive or negative manner.
- The regression controlled for population density, interstate highway density, land topography, and other county characteristics.
A subset of lands managed for conservation, habitat, or passive recreation has a small positive relationship to income and employment growth
The economists identified a slightly different result for a subset of lands that are primarily managed for conservation, habitat, or passive recreation (e.g., wildlife viewing) purposes. The subset excluded lands managed for revenue generation and developed recreation.
The economists found a small positive relationship between the percent of these lands in a county and income and employment growth.
- The results indicate that a 1 percent increase in the percentage of conservation, habitat, or passive recreation lands in a county may be related to a 0.28 percent increase in income growth and a 0.15 percent increase in employment growth.
- These lands frequently attract visitors for hiking, fishing, wildlife viewing, and other recreational activities. Visitors may generate business for local restaurants, hotels, gas stations, and recreational industry stores. These lands might also attract new businesses or residents to the local area, which can lead to county-level job and income growth.
Given the small relationship, the economists expect that recent acquisitions of these lands are unlikely to have generated a noticeable change in a county’s income or employment rate.
Results of this study for Washington are consistent with academic literature
The economists’ review of similar academic studies published over the last 25 years found no consistent evidence to suggest a negative relationship between the presence of public lands and local economies. In general, these studies:
- Either do not demonstrate a statistically significant relationship or show a positive relationship between the presence of public lands and regional income.
- Do not indicate that public lands have substantial effects on employment or wage growth.
- Suggest that population growth and increased property values are related to the amenities provided by the presence of public lands such as nature preserves, open space, parks, and forests.
Regression results indicate the effect of public lands in general, not specific sites
The regression analysis included all public natural resource lands collectively in Washington’s 39 counties. The results indicate that, in general, the proportion of these lands did not have a major effect on county economies between 1990 and 2010. However, this does not rule out the possibility that specific sites within a county may have a positive or negative impact on the local economy, as described in the next section.
Specific sites could have positive or negative economic impacts. These impacts are largely dependent on land use rather than ownership.
The WSU economists conducted economic impact analyses of specific state-owned recreation and habitat lands. Their analysis used prior economic activity to estimate the effect of land use changes on the economy in a specified area. Their analysis measured changes in business output (e.g., sales) and jobs. (Learn more in Technical Appendix.)
Each case study compared public use at a site to possible alternative private uses and applied a variety of assumptions to understand the potential economic impacts of individual sites. The analyses consider factors that are specific to each location (e.g., visitation and local economies), so the results cannot be generalized to other sites.
Different uses can generate positive or negative net impacts
A piece of land could potentially be used for a variety of purposes, regardless of ownership: retail, conservation, residential, industrial, recreation, or other uses. Each use has different economic impacts. The net impact is the difference in impact between the uses.
The case studies showed that public land may have a positive or negative net impact, depending on how the land is used and the potential alternative use. The case study of Pearrygin Lake State Park in Okanogan County demonstrates this point.
- Between 2004 and 2013, Washington State Parks (Parks) added over 600 acres surrounding Pearrygin Lake to an existing state park. Parks also completed a trail through the property and has begun planning additional camping and cabin accommodations.
- Available data indicates that without this acquisition, the property could have been developed for up to 61 homes. The economists considered two potential uses for the homes: vacation rentals or permanent homes for new county residents.
As shown in Exhibit 3, additional camping and cabins at the state park could have a positive or negative net impact when compared to different potential alternative uses.
- Compared to vacation homes, the public use has a slightly negative net economic impact (Scenario A).
- Compared to permanent homes, however, the public use has a positive net impact (Scenario B).
| Scenario A: Public Use Compared to Vacation Rentals | |||
|---|---|---|---|
| Public Use | Private Use | Net Impact of Public Use | |
| Description of Use | Additional cabins and campsites, increase in day use and overnight visits | Vacation rentals, 85% occupancy rate | |
| Annual Business Output | $7.5 M | $7.7 M | -$0.2 M |
| Jobs | 86.3 | 84.2 | +2.1 jobs |
| Scenario B: Public Use Compared to Permanent Homes for Residents | |||
| Public Use | Private Use | Net Impact of Public Use | |
| Description of Use | Additional cabins and campsites, increase in day use and overnight visits | Permanent homes for new county residents | |
| Annual Business Output | $7.5 M | $4.7 M | +$2.8 M |
| Jobs | 86.3 | 47.1 | +39.2 jobs |
Business Output: The value of goods and services produced in the study area. Can also be thought of as sales.
Jobs: Jobs represent an average that includes full time, part time, and seasonal/temporary positions.
Source: Economic impact analysis conducted for JLARC staff by WSU economists.
A range of reasonable assumptions results in a range of estimated impacts
Assumptions about the nature and extent of use can influence estimated impacts.
A case study of Cape Disappointment State Park in Pacific County demonstrates this point.
- Between 2004 and 2013, State Parks purchased 136 acres of undeveloped dune and ocean front property adjacent to Cape Disappointment State Park. State Parks purchased the property to improve trail access and views. The case study compares increased visits to the state park to increased visits from the creation of 12 new vacation rentals.
- To estimate the impacts, the WSU economists made assumptions about variables including increased visitation, expenditures, length of stay, and the purpose of the trip. These assumptions are based on information from State Parks, federal surveys, and data from a similar park in Oregon.
As shown in Exhibit 4, changing the assumption about the length of the average stay results in a range of estimated net impacts. Changing other variables (e.g., additional visitors, private use occupancy rate, amount spent by visitors) also would alter the estimated impacts.
| Scenario A: Assumes an Average Stay of 2 Days | |||
|---|---|---|---|
| Public Use: Increase in Visits | Private Use: 12 Vacation Rentals | Net Impact of Public Use | |
| Description of Use | Average stay 2 days | 85% occupancy rate | |
| Annual Business Output | $1.4 M | $2.4 M | -$1.0 M |
| Jobs | 16.8 | 27.3 | -10.5 jobs |
| Scenario B: Assumes an Average Stay of 3.5 Days | |||
| Public Use: Increase in Visits | Private Use: 12 Vacation Rentals | Net Impact of Public Use | |
| Description of Use | Average stay 3.5 days | 85% occupancy rate | |
| Annual Business Output | $2.1 M | $2.4 M | +$2.8 M |
| Jobs | 25.1 | 27.3 | -2.2 jobs | Scenario C: Assumes an Average Stay of 4 Days |
| Public Use: Increase in Visits | Private Use: 12 Vacation Rentals | Net Impact of Public Use | |
| Description of Use | Average stay 4 days | 85% occupancy rate | |
| Annual Business Output | $2.4 M | $2.4 M | $0 M |
| Jobs | 27.9 | 27.3 | +0.6 jobs |
Business Output: The value of goods and services produced in the study area. Can also be thought of as sales.
Jobs: Jobs represent an average that includes full time, part time, and seasonal/temporary positions.
Source: Economic impact analysis conducted for JLARC staff by WSU economists. The average visit length at a similar park in Oregon was 3.5 days.
If ownership changes, but the type and amount of use remains static, impacts may be negligible
The first two case studies compare major differences in land use and demonstrate measurable economic impacts. Public acquisition that does not change land use may not have similar effects.
Between fiscal years 2004 and 2013, the Washington Department of Fish and Wildlife (WDFW) purchased about 3,800 acres in Asotin County. The land, which was part of the 4-0 Ranch, is managed for habitat and passive recreation as part of the existing Blue Mountains Wildlife Area Complex. During the time period analyzed for the study, WDFW reports that it allowed the seller to continue grazing the ranch property at previous levels. Hunting and fishing activity persisted, with increased public access. Based on this information, the WSU economists anticipate negligible changes in measureable economic activity for the county overall.
Effects on property taxes are not part of this study but may be another consideration
A change from private to public ownership can affect local tax revenues because public landowners are exempt from property tax. This exemption is in the state Constitution.
The state’s property tax system is complex and includes over 1800 local taxing districts. Tax implications must be considered on a site-by-site basis. Effects vary based on the amount of taxes that are (or would be) paid by private owners, how much of the property tax is shifted to other residents, and whether state and federal agencies provide payments in lieu of taxes (PILT) or other compensation to the county.
The case studies highlighted some key issues for the Legislature
The case studies highlighted some key issues if economic analysis is used to inform decisions about public lands:
- Economic impact analysis is more informative when there is a change in land use that affects economic activity (e.g., more recreation or less agricultural production), not just a change in acreage. Individual acquisitions may not result in enough land use change to estimate impacts.
- Detailed, site-specific information improves the accuracy of the assumptions.
- A study focused on a single county or region may not consider the impacts to other counties or to the state.
- Economic measures may be only one consideration. The primary purpose of state natural resource lands is often to achieve other goals.
Economic impact analysis is more informative when there is a change in land use that affects economic activity, not just a change in acreage
The case studies demonstrated that identifying noticeable changes in an economy has more to do with changes in land use than changes in acreage. The acquisitions in the three case studies ranged from 136 acres to 3,800 acres, but the largest economic impacts were not related to the largest changes in acreage.
Individual land acquisitions may not generate enough change in land use for economic impact analysis
An economic impact analysis needs to include enough change in land use to cause a measureable change in the economy. Individual land acquisitions are unlikely to generate sufficient changes for analysis. For example, Pearrygin Lake was expanded through 14 separate transactions. To capture the impact, the analysis included all acquisitions and their related developments.
Federal land management agencies conduct economic analyses for large land bases such as national forests, rather than individual acquisitions.
Detailed, site-specific information improves the accuracy of the assumptions
Assumptions influence the results of economic analyses. The economists noted that while the state agencies have some data (e.g., number of current visitors at certain state parks, number of hunter days), better information would improve the accuracy of impact estimates. This includes detailed visitation and use rates, spending characteristics, and the ability of the site to attract visitors. While collecting some of this data could be challenging and resource intensive, the economists pointed out that several state and federal entities routinely collect such information through visitor surveys and other tools.
In the absence of detailed, site-specific data, state agencies have used the results of studies conducted by federal agencies, other states, or private organizations to describe the economic benefits of their lands. Caution is needed when extrapolating the results of these studies to a specific property in Washington. The broader results may not reflect the effects of specific state-owned properties. Even data that is specific to Washington-owned lands may not necessarily be accurate for each property or site owned by a state agency.
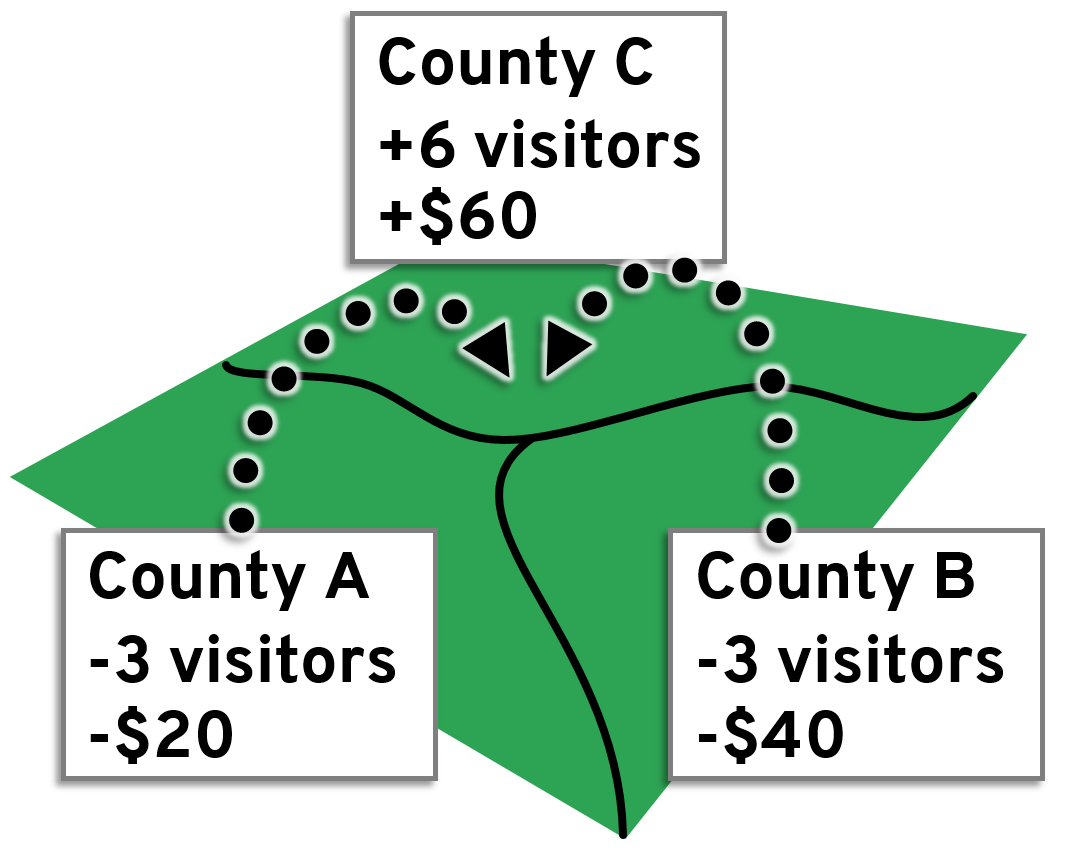
A study focused on a single county or region may not consider the impacts to other counties or to the state
Economic impact analyses identify the impacts to a particular study region, such as a county, state, or nation. This is called economic “perspective.”
There is no “correct” economic perspective when studying lands. A focus on one location may not identify impacts to another location. This is illustrated in Exhibit 5:
- New visitors to one county could represent a transfer from other counties around the state. This transfer may create positive impacts for one county (e.g., County C in Exhibit 5), but be detrimental to other counties (e.g., Counties A and B in Exhibit 5).
- A transfer of visitors from one county to another could have a net impact of zero statewide.
Economic measures may be only one consideration: The primary purpose of state natural resource lands is often to achieve other goals
Agency statutes emphasize preservation and conservation needs, maximizing recreational opportunities, and protecting cultural, historical, and ecological resources. Land management and acquisition decisions by state agencies are mainly focused on these statutory policy goals and financial obligations, rather than on local economic growth. State law does not require agencies to conduct economic analysis of recreation and habitat lands.
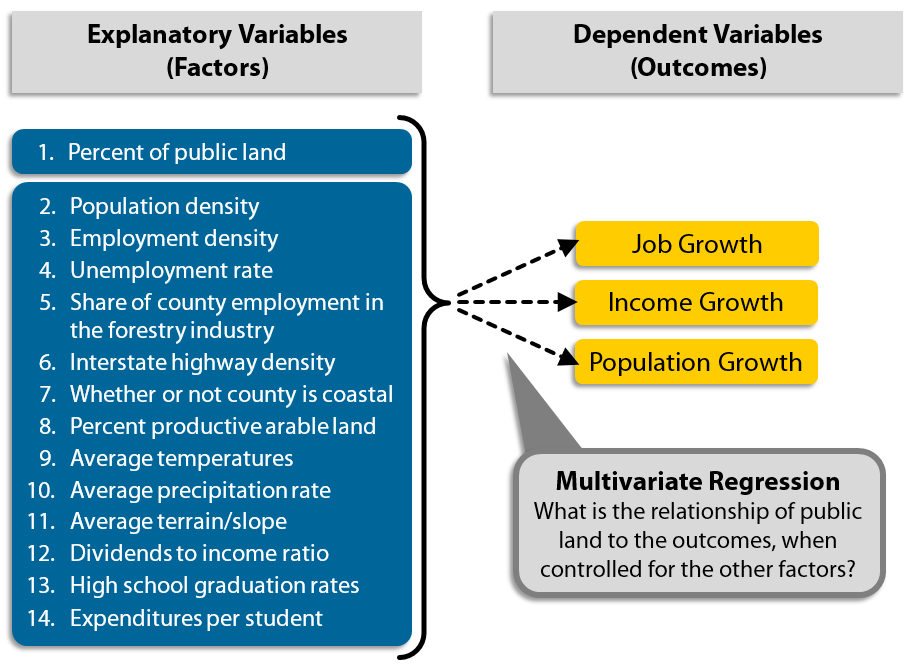
What is regression analysis?
A regression analysis is a commonly accepted statistical tool that helps researchers estimate the relationship between a factor and an outcome while controlling for other factors.
- A multivariate regression analysis considers multiple factors that may affect the outcome. It isolates the relationship between the factor of interest and the outcome from other factors.
- The factors are called explanatory variables.
- The outcome is called the dependent variable.
The regression results show the relative strength or weakness of a relationship between each factor and an outcome, and how likely it is that an observed relationship is due to chance.
Regression analysis establishes a rule of thumb for what we can expect to observe.
- While the results of a regression analysis may not be true for every individual case, the results are true in general for the population under review.
- Any exceptions are due to a circumstance or event that is outside of the norm.
General approach
The WSU economists used multivariate regression analysis to study the general relationship between the percentage of public land in Washington’s counties and economic vitality between 1990 and 2010. The economists ran a separate regression equation for each of the three economic vitality measures (Exhibit 6).
This analysis is applicable to marginal changes in total public land ownership over time, similar to the experience in Washington from 1990 to 2010. A different analysis would be needed if major changes in land ownership were anticipated, such as the selling of all national or state parks or forests to private owners.
Data included in WSU economists’ regression analysis
Economic vitality measures (dependent variables)
The economists defined economic vitality using three measures commonly found in peer-reviewed academic studies:
- Job growth (percent change in employment rate ).
- Income growth (percent change in household income).
- Net population growth (percent change in population excluding births and deaths).
The economists calculated percentage changes in job, income, and net population growth between 1990-2000 and between 2000-2010 for each county in Washington.
- These ten-year horizons are more likely to capture persistent trends that are difficult to observe when looking at annual values.
- The time period between 1990 and 2010 includes a decade of relatively rapid economic growth followed by a decade of relatively rapid economic decline. This variation is valuable for identifying factors that influence economic growth.
Percentage of public land (explanatory variable)
For this study, public lands are defined as state and federal recreation, habitat, conservation, and trust lands. The WSU economists used data compiled by the Recreation and Conservation Office (RCO) in July 2014 to determine the percentage of public natural resource lands by county. They made some adjustments to the RCO data for federal and aquatic lands.
The economists categorized the percentage of public lands into two groups (Exhibit 7).
| Lands managed primarily for conservation, habitat, or passive recreation purposes | Lands managed primarily for revenue generation, developed recreation, and other purposes |
| US Forest Service: Wilderness Areas and Designated Areas | US Forest Service: National Forests |
| Bureau of Land Management: Wilderness Study Areas and Areas of Critical Concern | Bureau of Land Management: All other lands |
| National Park Service (NPS): All National Parks | No USFWS properties |
| US Fish & Wildlife Service (USFWS): All sites | Bureau of Land Management: All other lands |
| State Lands: WDFW wildlife areas, DNR natural areas, undeveloped areas of many state parks | State Lands: State trust lands managed by DNR, developed areas of state parks |
Other county characteristics (other explanatory variables)
The analysis included other county characteristics that were either identified in JLARC’s study proviso or in recent peer-reviewed academic studies published on this topic.
Total observations
By including two decades worth of change in the economic vitality measures, there were 78 observations in each regression equation. This equates to two values per county for each dependent and explanatory variable analyzed.
Regression results
R-squared values
Each regression equation has an R-squared value, which is an indicator of how much variation in the economic vitality measure is explained by all of the explanatory variables. For example, an R-squared of 0.78 for the income growth model means that 78% of the variation found in income growth across counties is explained by the variables in the model.
These R-squared results (Exhibit 8) are comparable to recently published, peer-reviewed studies on the economic impacts of conservation lands in northern forest regions in the Midwest through the Northeastern United States.
| Economic Vitality Measure | Regression Equation R-Squared Value |
| Income growth | 0.78 |
| Employment growth | 0.64 |
| Population growth | 0.42 |
Statistical significance
Statistical significance is the confidence one can have that the observed relationship is not due to chance. The results presented below are the relationships between variables (i.e., the percent of public lands in a county and economic vitality factors) that were found to be statistically significant at the 99.9 percent confidence level.
- Lands managed for conservation, habitat, or passive recreation and Income Growth: A 1 percent increase in the percentage of these lands may be related to a 0.28 percent increase in county income growth.
- Lands managed for conservation, habitat, or passive recreation and Employment Growth: A 1 percent increase in the percentage of these lands may be related to a 0.15 percent increase in county employment growth.
A more detailed look at the statistical relationships found between all explanatory variables and the economic vitality measures is available here (PDF).
Economic impact analyses look at changes in measures in a specific region
Economic impact analyses can estimate changes in economic activity from an action such as development, construction, or investments by business or government. For our case studies, the economists reported business output and jobs for a specific region.
- Business output is the value of goods and services produced in the study area. Output also can be thought of as sales.
- Jobs are an average that includes full time, part time, and seasonal/temporary positions. Thus, a “job” may represent one job that lasts twelve months or three jobs that last four months. A job may reflect employment for an existing resident, a new resident, or someone who lives outside the area and commutes.
Economic impact analyses consider factors that are specific to the location being studied. The results do not predict economic impacts at other sites. For example, the estimated impacts for Pearrygin Lake State Park may not be applicable to other state parks.
The case studies analyzed specific state-owned natural resource sites
The WSU team used a case study approach to demonstrate the range of potential outcomes that can be shown with economic impact analyses.
JLARC staff selected sites across the state based on factors such as acquisition activity in the last ten years, readily available data, and identified alternative uses.
- Sites reflected habitat, recreation, and mixed habitat/recreation use.
- Each of the state natural resources agencies had at least one site included in the case studies: State Parks (Parks), the Department of Natural Resources (DNR), and the Department of Fish and Wildlife (WDFW).
JLARC staff used three of these case studies to highlight the economists’ conclusions about the importance of land use, available data, and reasonable assumptions. Each case study reflected the perspective and economic measures of either a single county or a region of two or three counties (Exhibit 9).
| Case Study | Perspective |
| Pearrygin Lake | Okanogan, Chelan, and Douglas Counties |
| Cape Disappointment | Grays Harbor and Pacific Counties |
| Blue Mountains Wildlife Area Complex | Asotin County |
The case studies were conducted with IMPLAN and a variety of data sources
The WSU economists used data from the three agencies, grant applications to the Recreation and Conservation Office, public records, and surveys done by federal agencies and Oregon.
The WSU economists used this data as the basis for the assumptions in each case study scenario. They used IMPLAN© to estimate the direct, indirect, and induced impacts for various scenarios in each case study. Results are shown in 2014 dollars and related jobs.
- IMPLAN is a widely accepted and used software model that uses input-output tables to account for how money flows between different sectors of the economy for a specific region.
- IMPLAN models the way a dollar spent in one sector would be spent and respent in other sectors of the economy. This is commonly called the “multiplier.”
- IMPLAN uses industry data and county-level economic data to generate a series of multipliers, which in turn estimate the total economic implications of economic activity.
Other analytical approaches can provide additional insights
By design, economic impact analyses include only new money coming into the economy. For example, the impacts of a park include spending by non-local visitors but exclude spending by local residents who visit the park. This is because impact analyses assume that local residents would spend their money elsewhere in the county if the park did not exist. This is different from a contribution study, which would include spending by non-local and local visitors to the park.
Other analytical approaches can be used to study all costs and benefits, housing values, or impacts to local governments. For example, a benefit-cost analysis could compare overall benefits to costs, including those that do not have a monetary value (e.g., water quality, health impacts). A fiscal impact analysis could estimate the changes in revenues and expenditures that local governments may experience.
Agency response(s) will be included in the final report, planned for July 2015.
Contact
Authors of this Study
Rebecca Connolly, Research Analyst, 360-786-5175
Stephanie Hoffman, Research Analyst, 360-786-5297
John Woolley, Audit Coordinator
Keenan Konopaski, Legislative Auditor
Joint Legislative Audit and Review Committee
Eastside Plaza Building #4, 2nd Floor
1300 Quince Street SE
PO Box 40910
Olympia, WA 98504-0910
Phone: 360-786-5171
FAX: 360-786-5180
Email: JLARC@leg.wa.gov
Audit Authority
The Joint Legislative Audit and Review Committee (JLARC) works to make state government operations more efficient and effective. The Committee is comprised of an equal number of House members and Senators, Democrats and Republicans.
JLARC's non-partisan staff auditors, under the direction of the Legislative Auditor, conduct performance audits, program evaluations, sunset reviews, and other analyses assigned by the Legislature and the Committee.
The statutory authority for JLARC, established in Chapter 44.28 RCW, requires the Legislative Auditor to ensure that JLARC studies are conducted in accordance with Generally Accepted Government Auditing Standards, as applicable to the scope of the audit. This study was conducted in accordance with those applicable standards. Those standards require auditors to plan and perform audits to obtain sufficient, appropriate evidence to provide a reasonable basis for findings and conclusions based on the audit objectives. The evidence obtained for this JLARC report provides a reasonable basis for the enclosed findings and conclusions, and any exceptions to the application of audit standards have been explicitly disclosed in the body of this report.
JLARC Members on Publication Date
Senators
Randi Becker
John Braun, Vice Chair
Sharon Brown
Annette Cleveland
David Frockt
Jeanne Kohl-Welles, Secretary
Mark Mullet
Ann Rivers
Representatives
Larry Haler
Ed Orcutt
Gerry Pollet
Derek Stanford, Chair
J.T. Wilcox
Hans Zeiger, Assistant Secretary
Scope & Objectives
Why a JLARC Study of Public Recreation and Habitat Lands?
In the 2013-15 Capital Budget (ESSB 5035), the Legislature directed the Joint Legislative Audit and Review Committee (JLARC) to conduct a study of public recreation and habitat lands that would describe the characteristics and costs of recent acquisitions, evaluate cost and benefit measures for these lands, and address potential effects of these lands on county economic vitality.
State Agencies Acquire These Lands with Different Funds and for Different Purposes
Much of the Legislature’s assignment focuses on lands acquired by three state agencies: the Department of Natural Resources (DNR), the State Parks and Recreation Commission (Parks), and the Department of Fish and Wildlife (WDFW). State law authorizes these agencies to acquire land for recreation or habitat. The departments fund many of these acquisitions with state grants, federal grants, or direct capital budget appropriations. Agencies also acquire property through donations, exchanges, and land transfers. The fund source may restrict how recipients can use the money or land.
The Department of Natural Resources manages lands that produce income for schools, local services, and other purposes. Many of these sites offer recreational opportunities such as campgrounds and trails. Statute also authorizes DNR to establish natural area preserves and natural resource conservation areas to protect habitat, native ecosystems, and rare species.
The Department of Fish and Wildlife has statutory duties to protect fish, wildlife, and habitat and to provide hunting, fishing, and recreational opportunities. WDFW manages land for plant and animal habitat; some areas are also open to hunting, hiking, and other recreation. WDFW’s water access sites provide opportunities for activities such as fishing and boating.
The State Parks and Recreation Commission has a statutory duty to manage lands set aside for parks. This includes developed parks, heritage sites, interpretive centers, and historic structures. Many properties also provide habitat for plants and animals.
Public Habitat and Recreation Lands May Affect County Economic Vitality
State, federal, local, and tribal governments own land in Washington counties. Use of these lands for habitat or recreation may affect a county’s economic vitality. The Recreation and Conservation Office completed two studies of these lands in 2005, offering a framework to identify economic impacts. Since then, the Legislature has requested additional reviews of public recreation and habitat lands and their effect on county property taxes. This study will look broadly at impacts to county economic vitality and will consider changes in addition to property taxes.
Study Scope
JLARC staff will create an inventory of the recreation and habitat acquisitions made by DNR, WDFW, and Parks over the last ten years, including land characteristics and associated costs. The study also will identify recent trust land acquisitions on which DNR provides or plans to provide recreation. JLARC staff will work with natural resource economists to evaluate the measures used to estimate benefits and costs, and to identify mechanisms to estimate the impact of public recreation and habitat lands on the economic vitality of Washington’s counties.
Study Objectives
This study will address the following questions by January 2015:
- What recreation and habitat lands have the Department of Natural Resources, the Department of Fish and Wildlife, and the State Parks and Recreation Commission acquired over the past ten years?
- What is the current use of these lands? How does the current use compare to the intended use? What are the estimated costs to bring these lands to the intended uses?
- How much do the agencies spend to manage recreation and habitat lands?
- Are there best practices for estimating economic benefits and costs of recreation and habitat lands?
- What measures and techniques do state and federal agencies use to estimate the economic benefits and costs of recreation and habitat lands? How do those measures compare with best practices?
- What are the estimated acres of recreation, habitat, and other land owned by federal, state, tribal, and local governments in each of Washington’s counties?
In addition, the study will address this question by April 2015:
- How can the Legislature reliably estimate the impact to a county’s economic vitality from an incremental change in recreation or habitat land, when considered with other county characteristics?
Timeframe for the Study
Staff will present preliminary reports in January 2015 and April 2015, as described above. Staff will present a final report in May 2015.