Dairy and fruit & vegetable beneficiaries had job and wage
increases that exceeded industry and state averages. Seafood beneficiaries saw a decline
in both. The preferences reduced the effective tax rates, but rates remain higher than
neighboring states.
July 2022
Executive Summary
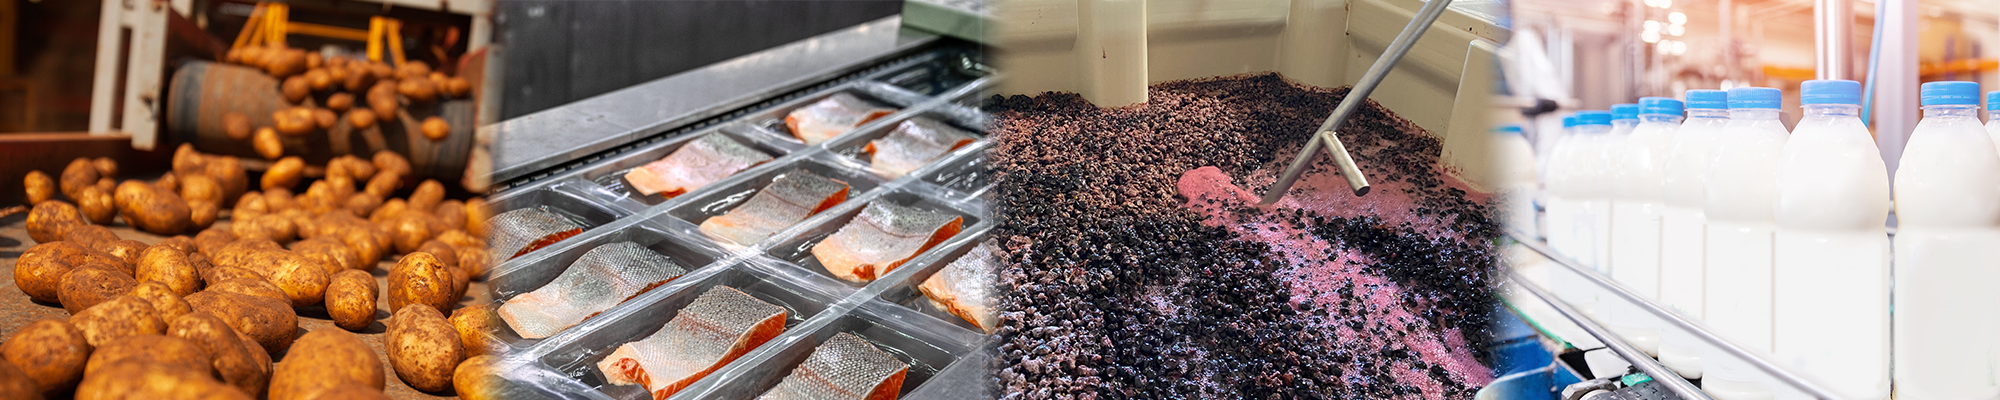
This review focuses on B&O tax preferences for three food processing industries
This review covers tax preferences for the dairy, fruit & vegetable, and seafood
processing industries. Each industry is currently exempt from B&O taxes on
qualifying activities. When the exemptions expire on July 1, 2025, the industries will
receive a preferential B&O tax rate of 0.138%.
The preferences generally apply to the following activities:
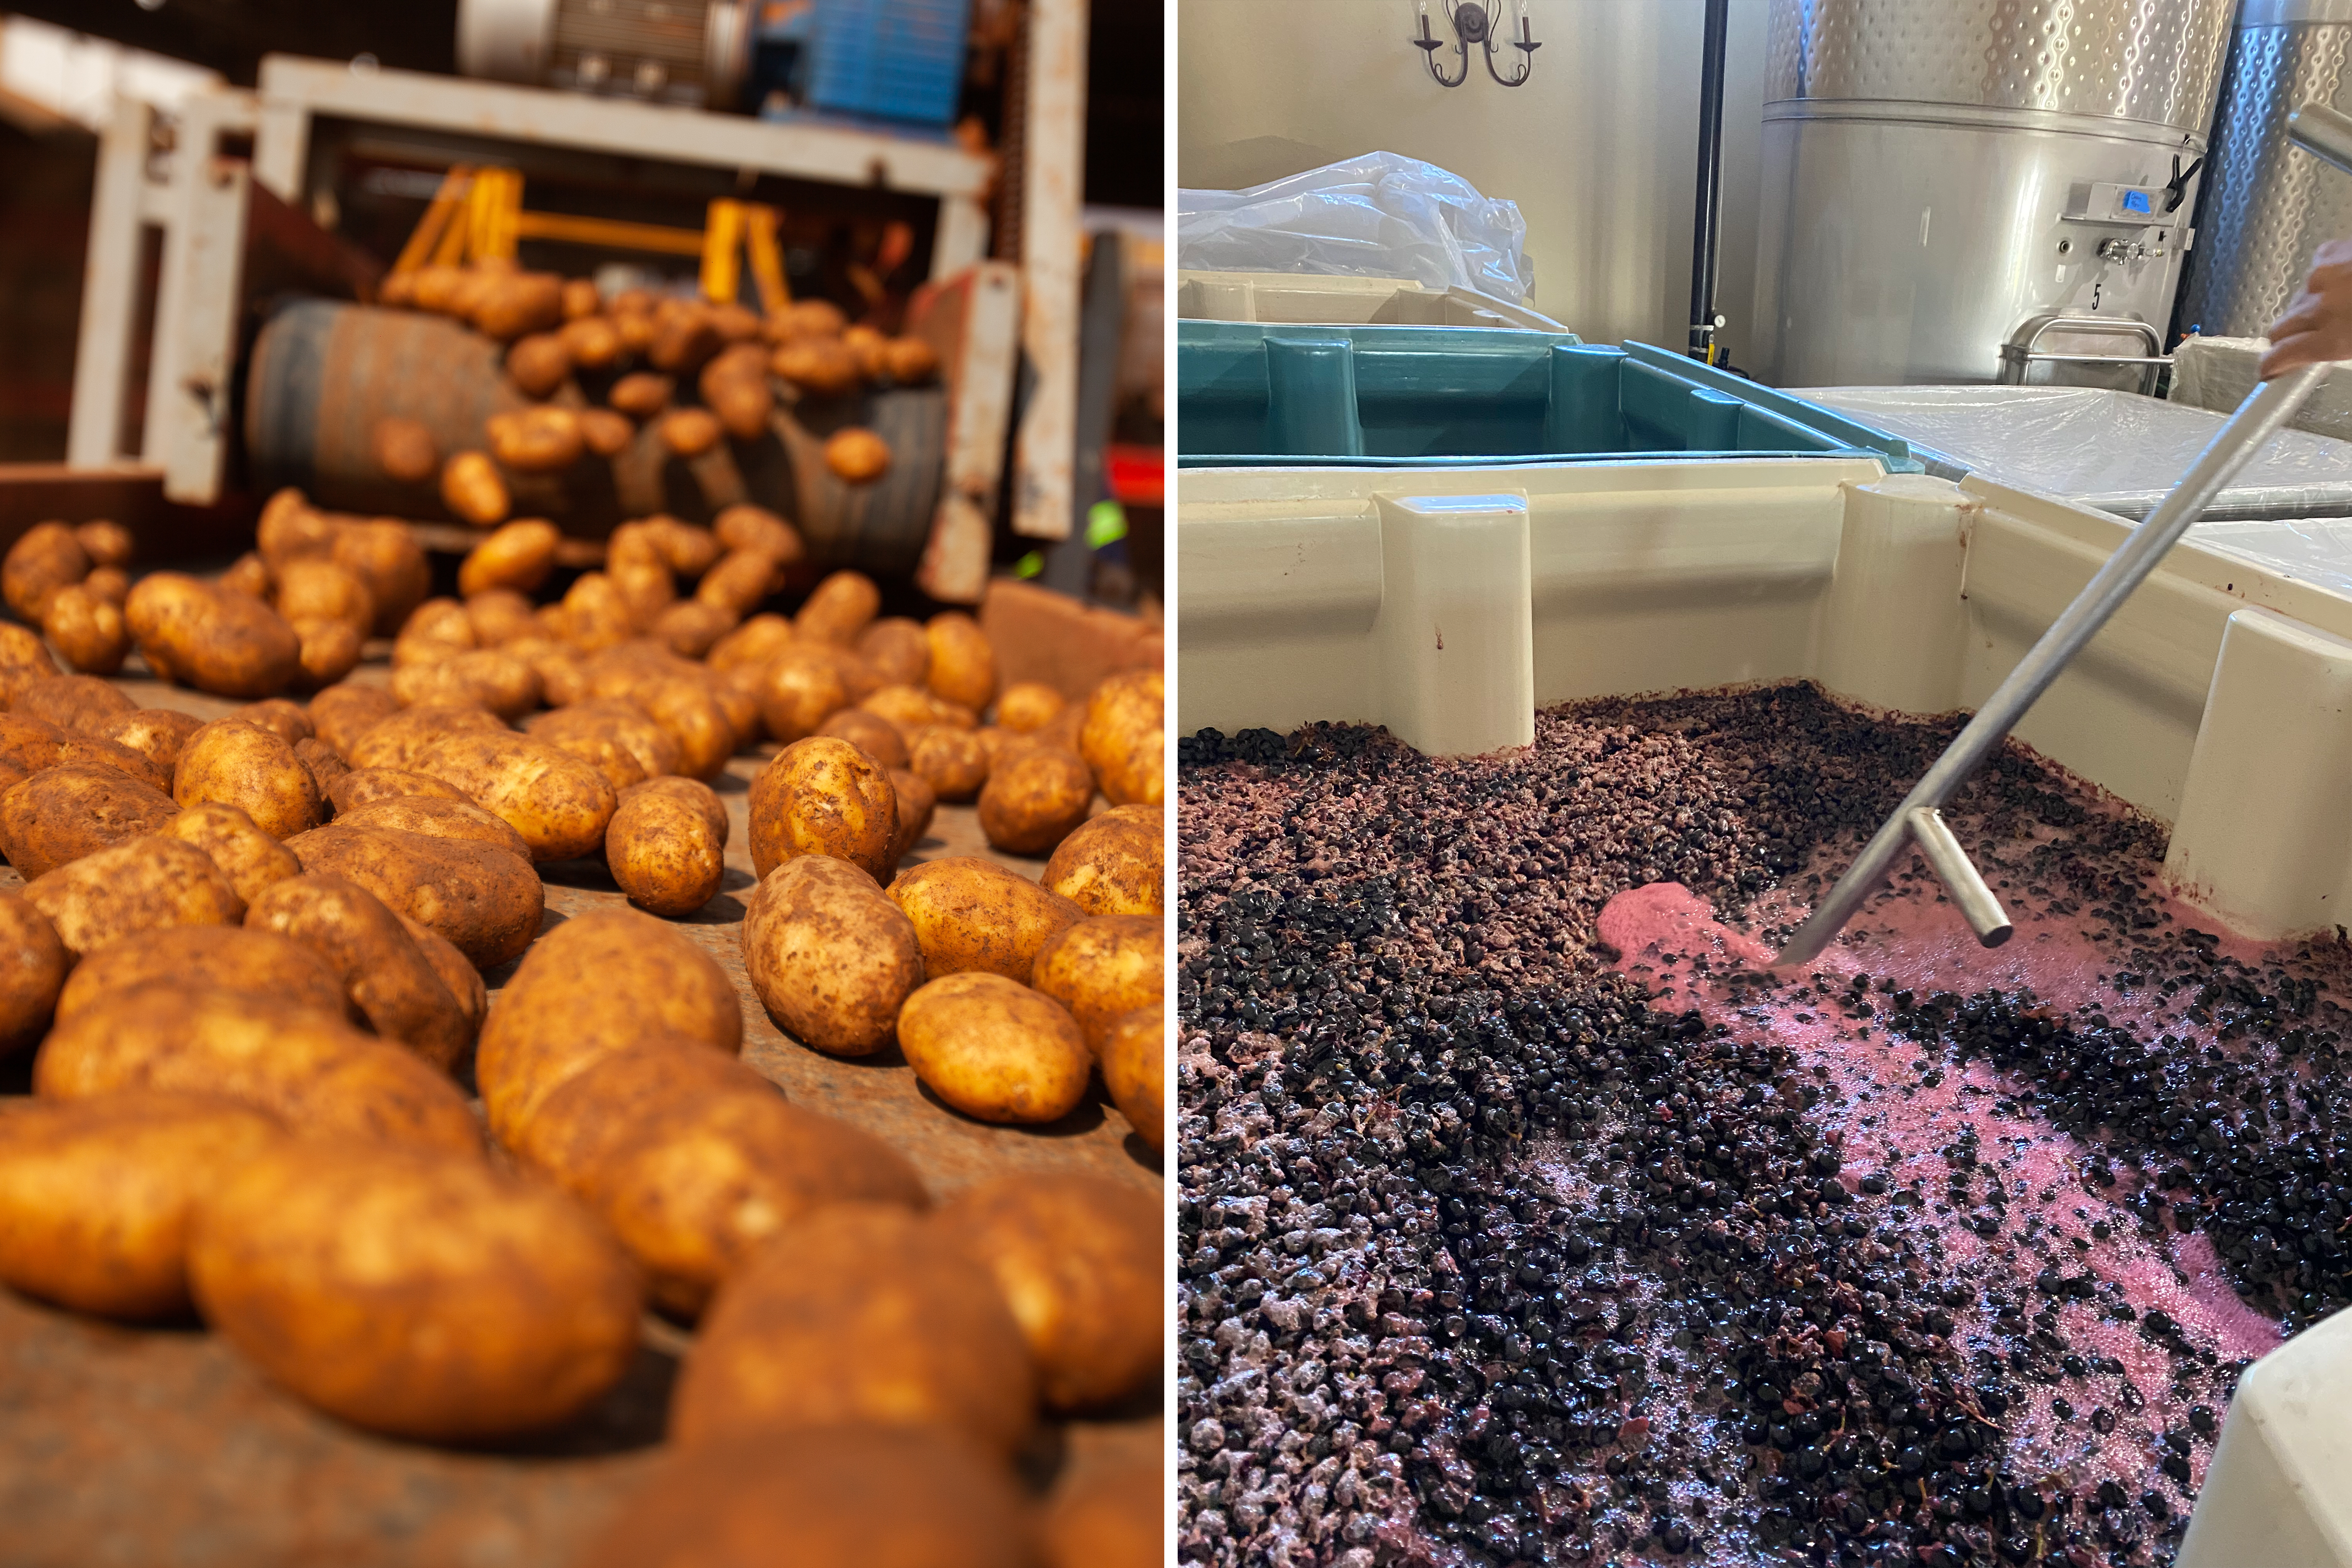
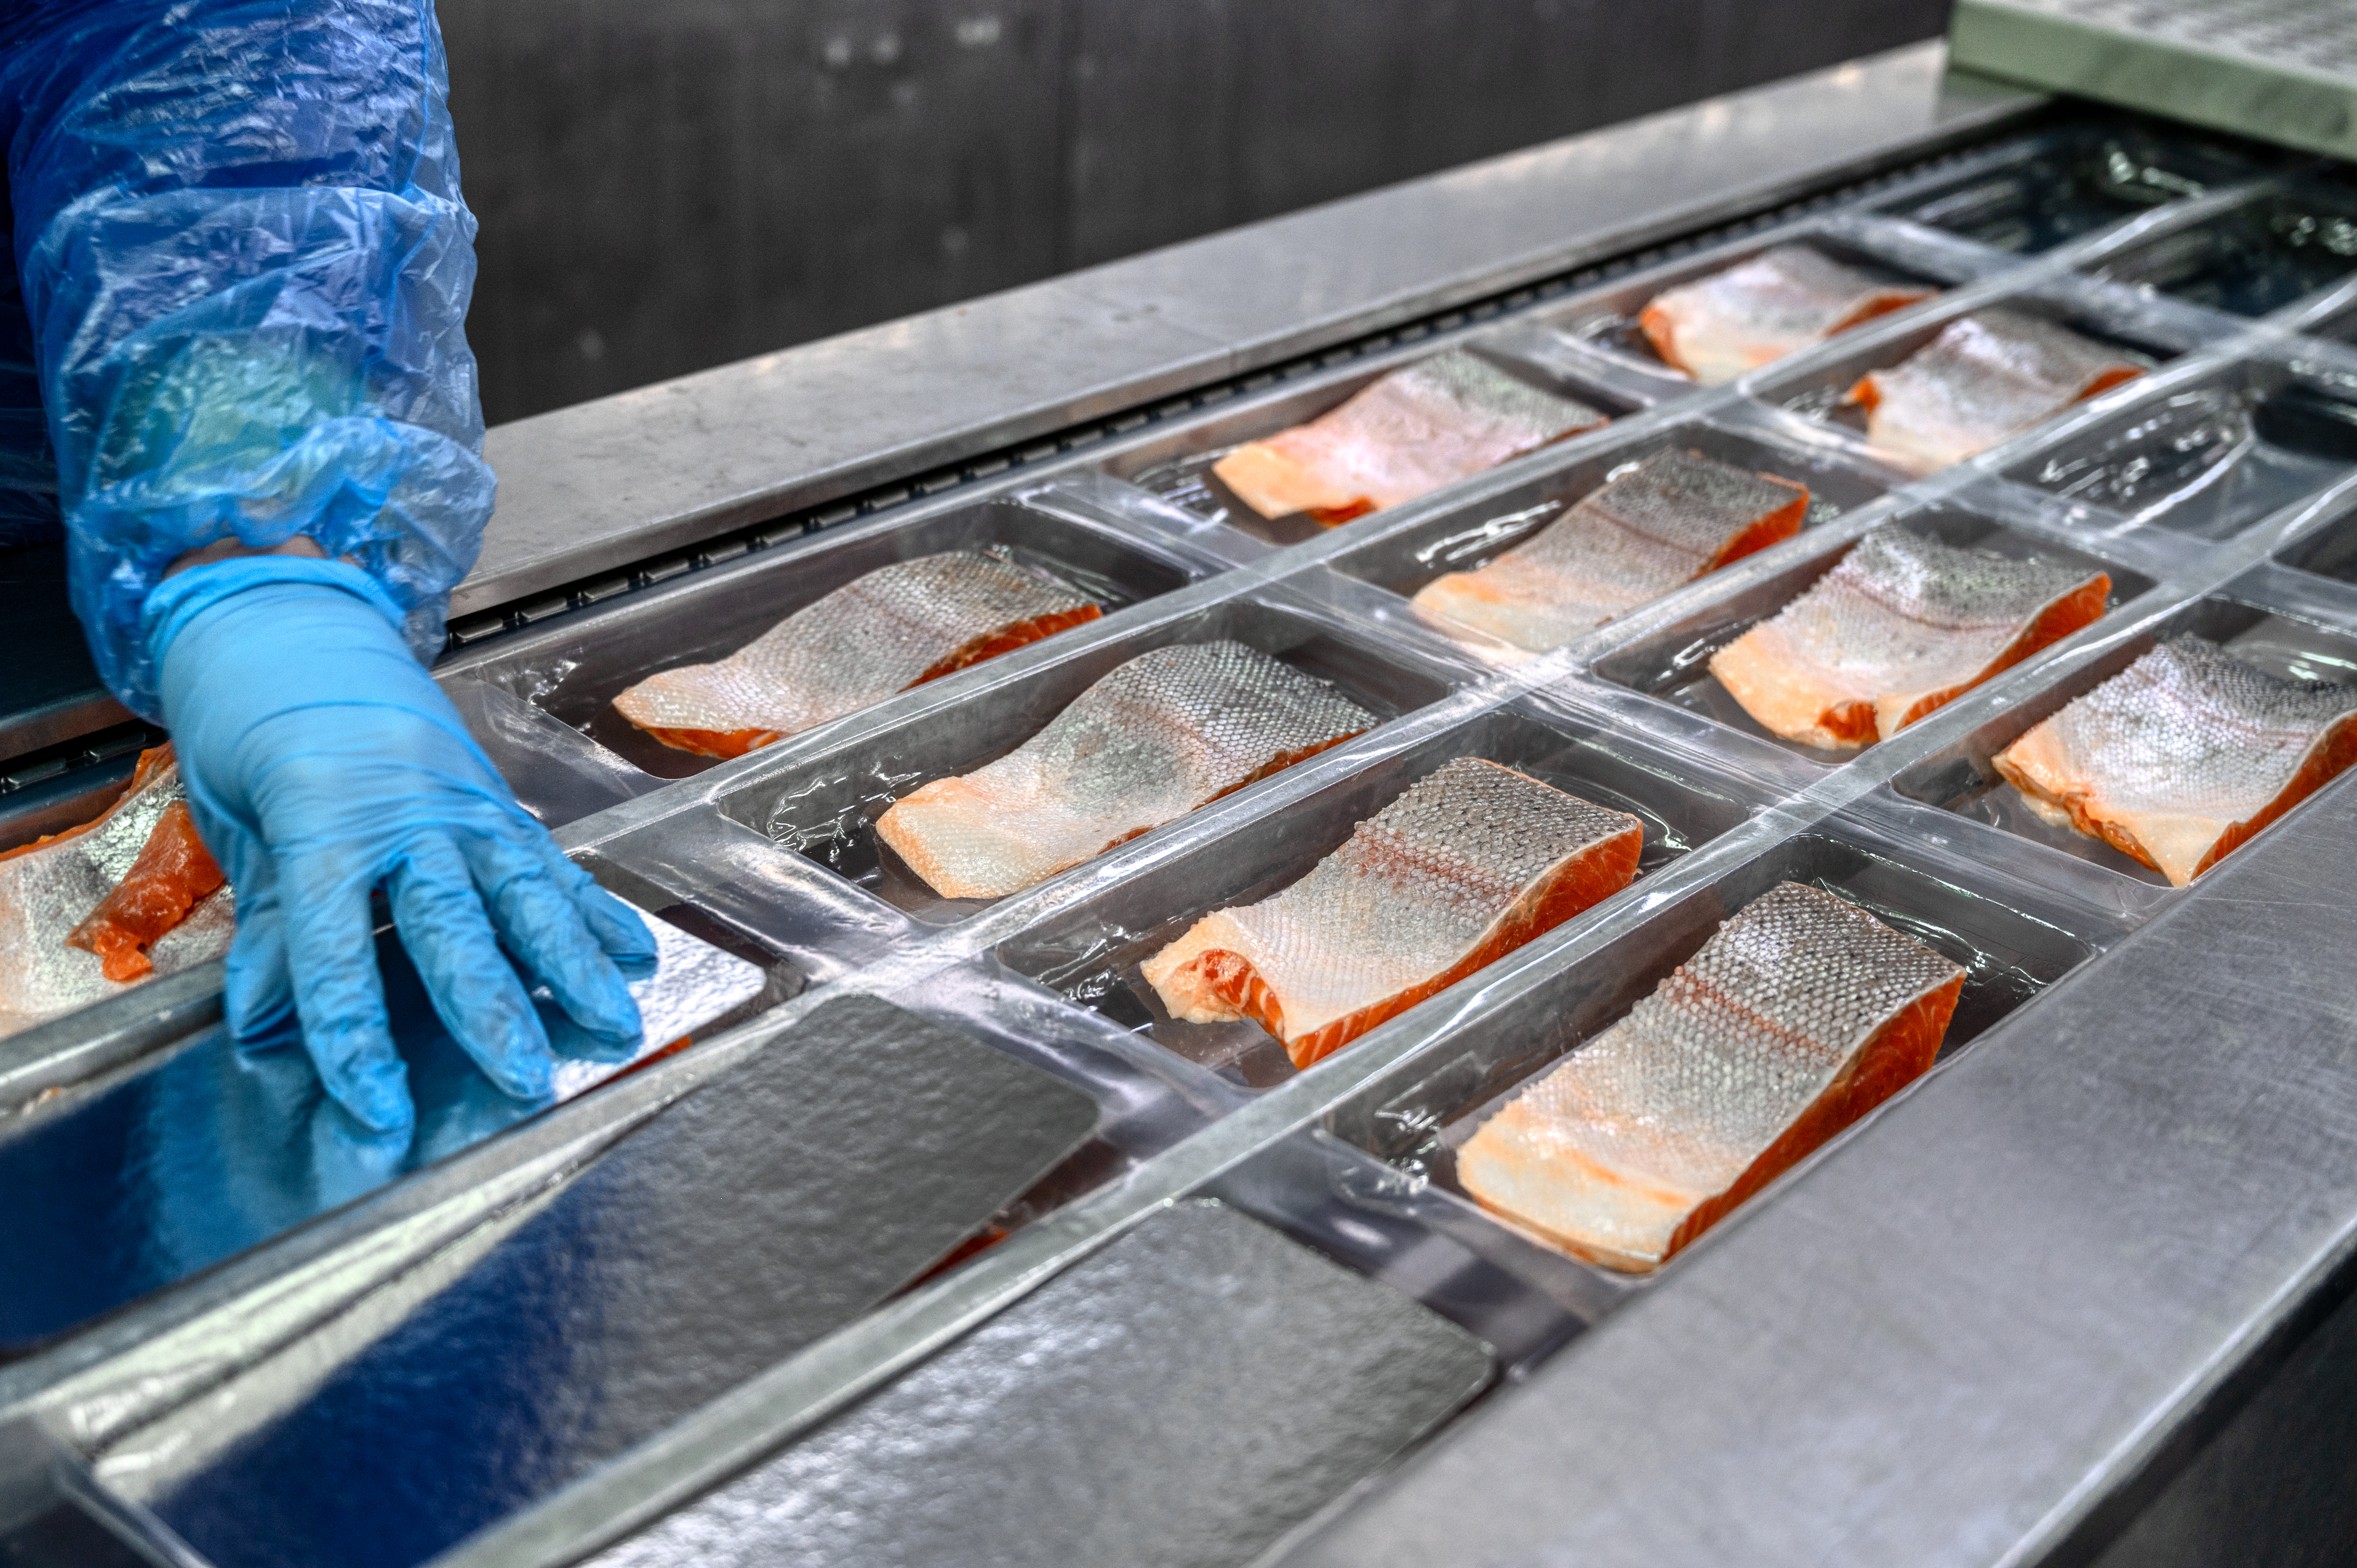
Manufacturing products such as yogurt and cheese, frozen french fries, wine, and
frozen fish fillets.
Selling these products wholesale to in-state buyers who transport the products out
of state.
Also included is a B&O tax exemption for dairy products sold as an ingredient or
component to manufacture other dairy products, such as powdered whey. This targeted
exemption expires June 30, 2023, and the activities will then be taxed at the general
wholesaling B&O tax rate of 0.484%.
The preferences provide tax relief to food processors. Two of the three industries
have created and retained jobs.
In 2015, the Legislature stated its two public policy objectives for these
preferences:
Provide tax relief to Washington's food processors.
Create and retain jobs.
Industry
Objective 1: Provide tax relief
Objective 2: Create and retain jobs
Dairy processors
Met. The preferences reduce the taxes of beneficiary businesses, though
taxes remain higher than neighboring states.
Met. Jobs for dairy beneficiaries grew by 27% and wages by 63% between
2015-20.
Fruit & vegetable processors
Met. The preferences reduce the taxes of beneficiary businesses, though
taxes remain higher than neighboring states.
Met. Jobs for fruit & vegetable beneficiaries grew by 44% between
2015-20. Wages grew by 84% for wineries and 66% for other fruit & vegetable
beneficiaries.
Seafood processors
Met. The preferences reduce the taxes of beneficiary businesses, though
taxes remain higher than neighboring states.
Not met. Jobs for seafood beneficiaries dropped by 10% and wages by 4%
between 2015-20.
Legislative Auditor's Recommendations
B&O preferences for dairy processors: Continue and clarify
The Legislature should continue the B&O tax preferences for dairy
processors because they are meeting the objectives of providing tax relief and
creating and retaining industry jobs. To facilitate future reviews, the Legislature
should clarify its expectations for job and wage growth and determine the level of tax
relief needed to meet those expectations.
B&O preference for dairy products used as an ingredient or component to create
other dairy products: Allow to expire
The Legislature should allow the preference for dairy products used as an
ingredient or component to create other dairy products to expire as scheduled June 30,
2023. The infant formula production in Sunnyside for which the 2013 preference was
intended did not occur.
B&O preferences for fruit & vegetable processors: Continue and clarify
The Legislature should continue the B&O tax preferences for fruit &
vegetable processors because they are meeting the objectives of providing tax relief
and creating and retaining industry jobs. To facilitate future reviews, the
Legislature should clarify its expectations for job and wage growth and determine the
level of tax relief needed to meet those expectations.
B&O tax preferences for seafood processors: Review and clarify
The Legislature should review the B&O tax preferences for seafood
processors because they are only meeting one of two objectives. While the preferences
are providing tax relief, beneficiary jobs in Washington have declined and their
employee wages have decreased. It is unclear why more businesses are not using the
preferences or what the Legislature's expectations are for the industry's jobs and
wages.
1. Preferences provide tax relief for three food processing industries
B&O tax preferences provide tax relief for three food
processing industries: dairy, fruit & vegetable, and seafood. Some sellers also
benefit.
JLARC staff reviewed B&O tax preferences for three food processing
industries
This review covers tax preferences for the dairy, fruit & vegetable, and seafood
processing industries. Each industry is currently exempt from B&O taxes. The
Legislature passed the exemptions in 2005 (fruit & vegetable) and 2006 (dairy and
seafood), and extended them in 2012, and again in 2015.
When the exemptions expire in 2025, the three industries will receive a preferential
B&O tax rate of 0.138%. The preferential rate for dairy products expires January
1, 2036. The preferential rates for the other two industries do not expire.
The preferences apply to the following activities:
Manufacturing products such as yogurt and cheese, frozen french fries, wine, and
frozen fish fillets.
Selling these products at wholesale to in-state buyers who transport the products
out of state. Only sales by the manufacturer qualify. For seafood, qualifying
wholesale sales are not limited to the manufacturer and retail sales also
qualify.
In addition to these three preferences, the 2013 Legislature also enacted a targeted
exemption for selling dairy products wholesale to buyers who use the products as
ingredients or components to manufacture other dairy products (e.g., infant formula).
This exemption expires June 30, 2023.
Exhibit 1.1: Food processors have received preferential B&O tax treatment for
decades. This will continue in future years.
Note: Percentages noted in exhibit represent the applicable B&O tax
rates. Source: JLARC staff analysis of statutes and history for RCW
82.04.260(1)(b), (c), and (d) and RCWs 82.04.4266, 82.04.4268, and 82.04.4269.
Preferences provide tax relief to Washington's dairy, fruit & vegetable, and
seafood processors
One of the Legislature's stated goals for the preferences is to provide tax relief.
In calendar year 2020, beneficiaries in the three industries saved a combined $22.2
million in B&O taxes due to the preferences.
Exhibit 1.2: The dairy preference had the most beneficiaries in 2018
Source: JLARC staff analysis of DOR Incentive and Reporting Public Disclosure web
page data for dairy products B&O tax deduction, along with DOR confidential tax
return detail.
Exhibit 1.3: The fruit & vegetable preference had the most beneficiaries in
2018
Source: JLARC staff analysis of DOR Incentive and Reporting Public Disclosure web
page data for fruit & vegetable businesses B&O tax deduction, along with DOR
confidential tax return detail.
Exhibit 1.4: The seafood preference had the most beneficiaries in 2018
Source: JLARC staff analysis of DOR Incentive and Reporting Public Disclosure web
page data for seafood product businesses B&O tax deduction, along with DOR
confidential tax return detail.
Appendices provide detail on all the beneficiaries and their individual savings
JLARC staff used tax preference reporting data available on the Department of
Revenue's web site to compile tables that list the businesses that claimed the tax
exemptions, the total savings for each business, and the total savings for each
industry. The detail is provided for calendar years 2015 through 2020, the last year
of data available when this report was completed.
2. Dairy beneficiaries: Jobs grew by 27% and wages by 63%
Preference is widely used among dairy processing industry, with
one firm, Darigold, claiming between 80-87% of savings. Beneficiary jobs and wages grew
faster than state and food manufacturing averages.
Beneficiaries manufacture and sell dairy products, such as yogurt and cheese
Highlights
Beneficiaries employ 94% of industry workers.
Darigold is the largest
preference user, claiming on average 83% of all savings from 2015 to
2020.
Jobs grew by 27% from 2015 to 2020.
Wages grew by 63% from
2015 to 2020.
Full exemption expires July 1, 2025.
To qualify for the preference, a business must perform one of the following
activities:
Manufacture dairy products, such as milk, yogurt or cheese.
Sell dairy products wholesale to in-state buyers who then transport the products
outside the state. The sellers must be the manufacturers.
Sell dairy products wholesale to buyers who use the products as ingredients or
components to manufacture other dairy products. Examples include infant formula and
powdered whey. The sellers must be the manufacturers.
This specific exemption expires on June 30, 2023, and the activities will then
be taxed at the general 0.484% wholesaling and manufacturing B&O tax rates.
Legislative testimony indicates this was intended to encourage development of
an infant formula production facility in Sunnyside in 2013. Industry
representatives stated that the specific project fell through. However, the
preference has been used by three to eight businesses each year since 2015.
Jobs for dairy beneficiaries grew from 2015 to 2019, but dropped in 2020
Dairy beneficiary employment grew 32% from Quarter 1, 2015, through Quarter 3, 2019.
Then employment for dairy beneficiaries dropped, likely due to impacted operations at
the start of the COVID-19 pandemic. Employment for dairy beneficiaries grew again in
late 2020 as businesses adapted to operating during the pandemic.
Beneficiaries finished 2020 with a 27% increase in overall employment when compared
to Quarter 1, 2015. This is higher than the statewide average employment growth and
growth in the broader food manufacturing industry.
Exhibit 2.1: Job growth for dairy beneficiaries was more than double the growth in
food manufacturing and three times the growth in statewide employment
Source: JLARC staff analysis of Employment Security Department Quarterly Census of
Employment data for: Washington total employment, all covered employment; food
manufacturing industry employment; and dairy beneficiary employment for Quarter 1,
2015, through Quarter 4, 2020.
Wages increased by 63% among dairy beneficiary employees from 2015 through 2020
Unlike employment numbers, which show a decrease since Quarter 3, 2019, dairy
industry wage data shows an overall increase during the same time period. While there
was a dip in both dairy beneficiary and food manufacturing wages in 2019, wages for
both, as well as statewide wages, increased in 2020 past their previous highs.
Industry representatives told JLARC staff that wage increases are one of the tools
they have used to hire and retain workers in the tight labor market that now exists.
The average wage in 2020 for dairy beneficiaries was $61,857.
Exhibit 2.2: Since 2018, wages for dairy beneficiary employees have increased at a
faster rate than statewide wages and wages in the food manufacturing industry
Source: JLARC staff analysis of Employment Security Department Quarterly Census of
Employment wage data for: Washington total covered, total wages, all covered
employees; food manufacturing industry wages, and dairy beneficiary wages for Quarter
1, 2015, through Quarter 4, 2020.
Darigold, Inc., is the largest preference user
Since 2015, Darigold, Inc., has claimed between 80% and 87% of all preference
savings. The other dairy processors, ranging between 14 and 43 businesses, made up
between 13% and 20% of preference users from 2015 through 2020. Appendix
A provides a full listing of dairy beneficiaries and their savings.
Exhibit 2.3: Darigold claimed between 80% and 87% of total preference savings
between 2015 and 2020
Source: JLARC staff analysis of Department of Revenue Incentive and Reporting Public
Disclosure web page detail for dairy product deduction, 2015-2020.
Beneficiaries estimated to save $12.6 million in the 2021-23 biennium
JLARC staff used actual beneficiary data (2015-2020) to estimate the future savings
for dairy beneficiaries.
The estimate is also based on the following considerations:
The special B&O tax exemption for dairy products sold as an ingredient to
produce other dairy products will expire on June 30, 2023. Since 2015, this
exemption has averaged $62,000 in savings annually.
JLARC staff estimated a compound average growth rateA method for expressing multi-year growth as a constant rate
of return over the time period. of 6.44% based on use of the
preference from 2015 through 2019. This rate was included in the estimate of future
use of the B&O exemption through its scheduled expiration on June 30, 2025.
Exhibit 2.4: Beneficiaries estimated to save $10.5 million in the 18 months before
the B&O exemption expires
Biennium
Calendar Year
Estimated Beneficiary Savings
2019-21
(July 1, 2019 - June 30, 2021)
2020
$5,437,000
2021
$5,755,000
2021-23
(July 1, 2021 -- June 30, 2023)
2022
$6,121,000
2023
$6,511,000
2023-25
(July 1, 2023 -- June 30, 2025)
2024
$6,865,000
2025
(thru 6/30/2025)
$3,653,000
Full exemption expires June 30, 2025. Beneficiaries will
pay a preferential B&O tax rate of 0.138% effective July 1,
2025.
Estimated 2023-25 Biennial Savings
$ 10,518,000
Source: JLARC staff analysis of Department of Revenue Incentive and Reporting Public
Disclosure web page for dairy product B&O tax deduction and confidential tax
return detail. Future growth calculated using 6.44% compound average growth rate
determined by JLARC staff based on preference use from 2015 - 2019.
Beginning July 1, 2025, dairy beneficiaries will pay a preferential B&O tax rate
of 0.138% on their qualifying manufacturing and wholesaling activities. The general
B&O tax rate for these activities is 0.484%. The preferential rate is scheduled to
expire January 1, 2036, for dairy products.
Exhibit 2.5: Beneficiaries estimated to save $12.2 million in the 2027-29 biennium
using the preferential 0.138% B&O rate
Biennium
Calendar Year
Estimated Beneficiary Savings
2025-27
(July 1, 2025 -- June 30, 2026)
2025
(beginning 7/01/2025)
$2,612,000
2026
$5,559,000
2027-29
(July 1, 2026-- June 30, 2028)
2027
$5,917,000
2028
$6,298,000
Estimated 2027-29 Biennial Savings
$12,215,000
Source: JLARC staff estimate based on actual B&O tax exemption use per
Department of Revenue Incentive and Reporting Public Disclosure web page and
confidential tax return detail. Future growth calculated using 6.44% compound average
growth rate determined by JLARC staff based on actual preference use from 2015-2019.
Savings from the preference represented 0.88% of beneficiaries' total taxable amount
from 2016 to 2020
The Legislature directed JLARC staff to answer the following two questions about
taxable income when it extended the B&O tax exemption in 2015:
1. What is the change in total taxable income for businesses claiming the
exemption?
The total taxable amountTotal B&O
tax gross receipts minus B&O tax deductions. reported on
Department of Revenue tax returns for dairy beneficiaries increased from $516 million
in 2016 to $599 million in 2019, a 16% increase. The total taxable amount dropped by
$10.1 million from 2019 to 2020.
2. What percentage of total taxable income does the exemption represent for
businesses claiming it?
The preference represented between 0.80% and 0.94% of the total taxable amount for
dairy beneficiaries between 2016 and 2020. The average over these five years was
0.88%.
Preliminary Report: Food Processors
July 2022
Review Details
3. Fruit & vegetable beneficiaries: Jobs grew by 44% and wages by 69%
Wineries are the most common users of the fruit & vegetable
preference. Job and wage growth for beneficiaries exceeded state and food manufacturing
industry averages.
Beneficiaries manufacture and sell fruit & vegetable products, such as frozen
french fries and wine
Highlights
Beneficiaries employ 74% of fruit & vegetable industry workers.
Wineries comprise 71% of the beneficiaries, but claim 19% of the tax savings.
Jobs grew by 44% from 2015 to 2020.
Wages grew by 69% from 2015 to 2020.
Full exemption expires July 1, 2025.
To qualify for the preference, a business must perform one of the following
activities:
Manufacture fruit or vegetable products, such as canned pears, apple juice, frozen
french fries, or wine.
Sell fruit or vegetable products wholesale to in-state buyers who then transport
the products outside the state. The sellers must be the manufacturers.
Wineries comprise 71% of the fruit & vegetable beneficiaries, but claim 19% of
the tax savings
Between 2015 and 2020, wineries made up between 69% and 74% of all fruit &
vegetable beneficiaries. However, wineries claim between 17% and 21% of the preference
savings. Many of Washington's wineries are small businesses so their total exempt
income is lower than larger fruit & vegetable manufacturers. For example, in 2020,
the average winery claim was $15,800 and the average fruit & vegetable processor
claim was $178,900.
Appendix B lists the fruit & vegetable beneficiaries, their savings, and
identifies which businesses are wineries.
Exhibit 3.1: Wineries make up the majority of the beneficiaries but claim less of
the savings
Source: JLARC staff analysis of Department of Revenue Incentive and Reporting Public
Disclosure web page detail for fruit & vegetable deduction, 2015-2020.
Jobs for all fruit & vegetable beneficiaries grew 44% from 2015 to 2019, but
dropped in 2020
Fruit & vegetable beneficiary employment, including wineries, grew 44% from
Quarter 1, 2015, to Quarter 3, 2019.
Employment dropped in early 2020, likely due to impacted operations at the start of
the COVID-19 pandemic. However, beneficiaries adapted to operating during the pandemic
and experienced more job growth than the statewide average employment growth and
growth in the broader food manufacturing industry through the end of 2020.
Beneficiaries finished 2020 with a 23% increase in employment compared to the start of
2015.
Exhibit 3.2: Job growth for beneficiaries was more than double the growth in the
food manufacturing industry and more than triple the growth in statewide employment
from 2015-2020
Source: JLARC staff analysis of Employment Security Department Quarterly Census of
Employment data for: Washington total employment, all covered employment; food
manufacturing industry employment (NAICSNorth American Industry Classification System.
311); and fruit & vegetable, including wineries, beneficiary employment for
Quarter 1, 2015, through Quarter 4, 2020.
When wineries are separated from other fruit & vegetable beneficiaries, their
growth is more than double the growth of all other fruit & vegetable beneficiaries
between 2015 and 2020. Job growth for both groups peaked in 2019 and fell in 2020.
Exhibit 3.3: Job growth at wineries and other fruit & vegetable beneficiaries
peaked in 2019 at 71% and 38%, respectively
Source: JLARC staff analysis of Employment Security Department Quarterly Census of
Employment data for: fruit & vegetable manufacturing (NAICS 3114) and winery
(NAICS 312130) beneficiary employment for Quarter 1, 2015, through Quarter 4, 2020.
Wages grew by 69% for fruit & vegetable beneficiaries between 2015-2020
Wages paid by fruit & vegetable beneficiaries, including wineries, grew 69% from
Quarter 1, 2015, through the end of 2020.
Beneficiary wages dropped during Quarter 2, 2020, in response to the impacts of the
COVID-19 pandemic, but rose again at a faster rate than the rest of the food
manufacturing industry. Fruit & vegetable industry representatives and
beneficiaries report that wage increases are one of the main incentives they have used
to hire and retain workers in the tight labor market that developed since 2019. The
average wage in 2020 for fruit & vegetable beneficiaries was $49,853.
Exhibit 3.4: Beneficiary wages grew 69% between 2015-2020, surpassing growth in the
broader food manufacturing industry and statewide averages
Source: JLARC staff analysis of Employment Security Department Quarterly Census of
Employment wage data for: Washington total covered, total wages, all covered
employees; food manufacturing industry wages; and combined fruit & vegetable
processors and winery beneficiary wages for Quarter 1, 2015, through Quarter 4, 2020.
Wages for winery beneficiaries increased by 84% while wages for other fruit &
vegetable beneficiaries rose by 66%. The average wage in 2020 for winery beneficiaries
was $45,605, while the average wage for other fruit & vegetable beneficiaries was
$51,019.
Exhibit 3.5: Wages for winery beneficiaries grew at a faster rate than other fruit
& vegetable beneficiaries
Source: JLARC staff analysis of Employment Security Department Quarterly Census of
Employment wage data for: fruit & vegetable manufacturer beneficiary wages and
winery beneficiary wages for Quarter 1, 2015, through Quarter 4, 2020.
Beneficiaries estimated to save $29 million in the 2021-23 biennium
JLARC staff estimated the future savings for fruit & vegetable beneficiaries
using actual beneficiary data from calendar years 2015 through 2020.
JLARC staff estimated a compound average growth rateA method for expressing multi-year growth as a constant rate
of return over the time period. of 2.04% based on use of the
preference from 2015 through 2019. This rate was included in the estimate of future
use of the B&O exemption through its scheduled expiration on June 30, 2025.
Exhibit 3.6: Beneficiaries estimated to save $22.7 million in the 18 months before
the B&O exemption expires
Biennium
Calendar Year
Estimated Beneficiary Savings
2019-21
(7/01/2019 - 6/30/2021)
2020
$13,856,000
2021
$14,138,000
2021-23
(7/01/2021 - 6/30/2023)
2022
$14,427,000
2023
$14,721,000
2023-25
(7/01/2023 - 6/30/2025)
2024
$15,021,000
2025 (thru 6/30/2025)
$7,664,000
Full exemption expires June 30, 2025. Beneficiaries will pay a
preferential B&O tax rate of 0.138% effective July 1, 2025.
2023-2025 Biennial Savings
$22,685,000
Source: JLARC staff analysis of Department of Revenue Incentive and Reporting Public
Disclosure web page for fruit & vegetable B&O tax exemption and confidential
tax return detail. Future growth calculated using 2.04% compound average growth rate
calculated by JLARC staff based on preference use from 2015-2019.
Beginning July 1, 2025, fruit & vegetable beneficiaries, including wineries, will
pay a preferential B&O tax rate of 0.138% on their qualifying manufacturing and
wholesaling activities. The general B&O tax rate for these activities is currently
0.484%. Under current law, the preferential rate does not expire.
Exhibit 3.7: Beneficiaries estimated to save $23 million in the 2027-29 biennium
using the preferential B&O tax rate of 0.138%
Biennium
Calendar Year
Estimated Beneficiary Savings
2025-27
(July 1, 2025 -- June 30, 2026)
2025
(beginning 7/01/2025)
$5,479,000
2026
$11,181,000
2027-29
(July 1, 2026-- June 30, 2028)
2027
$11,409,000
2028
$11,642,000
Estimated 2027-29 Biennial Savings
$23,051,000
Source: JLARC staff estimate based on actual B&O tax exemption use per
Department of Revenue Incentive and Reporting Public Disclosure web page and
confidential tax return detail. Future growth calculated using 2.04% compound average
growth rate determined by JLARC staff based on actual preference use from 2015-2019.
Savings from the preference represented 1.06% of beneficiaries' total taxable
amount
The Legislature directed JLARC staff to answer the following two questions about
taxable income when it extended the B&O tax exemption in 2015:
1. What is the change in total taxable income for businesses claiming the
exemption?
The total taxable amountTotal B&O
tax gross receipts minus B&O tax deductions. reported on
Department of Revenue tax returns for all beneficiaries, including wineries, increased
from $1.53 billion in 2016 to $1.79 billion in 2019, a 17% increase. The total taxable
amount dropped from 2019 to 2020 by 19.3%.
2. What percentage of total taxable income does the exemption represent for
businesses claiming it?
The preference represented between 0.95% and 1.12% of the total taxable amount for
all beneficiaries, including wineries, between 2016 and 2020. The average over these
five years was 1.06%.
Preliminary Report: Food Processors
July 2022
Review Details
4. Seafood beneficiaries: Jobs fell 10% and wages fell 4%
Seafood beneficiaries employ 51% or less of their industry's
workers. Their jobs declined, but at a slower pace than the rest of the industry. Their
average wages also fell.
Beneficiaries manufacture and sell seafood products, such as frozen fish fillets and
fish sticks
Highlights
Seafood beneficiaries employ 51% or less of their industry's
workers, a smaller share than dairy and fruit & vegetable beneficiaries.
Jobs fell 10% from 2015 to 2020.
Wages fell 4% from 2015 to
2020.
Full exemption expires July 1, 2025.
To qualify for the preference, a business must perform one of the following
activities:
Manufacture certain seafood products, such as fish fillets or fish sticks.
Sell seafood products wholesale or retail to in-state buyers who then transport
the products outside the state. The seller does not need to be the manufacturer.
Beneficiaries employ between 35% and 51% of all seafood processing workers in
Washington
Since 2015, seafood beneficiaries have employed between 35% and 51% of all workers in
Washington's seafood products manufacturing industry (NAICSNorth American Industry Classification System.
3117). This is a lower share of the industry than dairy and fruit & vegetable
beneficiaries employ (94% and 74%, respectively).
Based on discussions with regional economists and industry representatives and a
review of state economic reports, there are several possible reasons for why
beneficiaries employ a smaller portion of their industry's workers:
Not all of Washington's seafood processing businesses are conducting qualifying
activities in the state, and therefore cannot claim the preference. Seafood
processing businesses may be headquartered in Washington, but conduct their
processing activities out of state. For example, much of the fishing takes place in
Alaska and businesses may process their seafood products on fishing vessels or in
Alaska-based facilities.
Seafood industry representatives indicated that they sometimes hire self-employed
operators to fish and process their catch. The employment figures in this report are
derived from unemployment insurance records. While the employees of the seafood firm
are included in those records, these self-employed owners and operators are not.
Jobs for seafood beneficiaries dropped 10% between 2015-2020, which is less than the
27% loss in seafood processing jobs overall
JLARC staff found that the total number of Washington seafood processing jobs
decreased between 2015 and 2020. These job losses impacted beneficiaries as well as
businesses that did not claim the preference.
For seafood beneficiaries, employment peaked in Quarter 1, 2019, when overall
employment increased by 9% over Quarter 1, 2015. By the end of 2020, beneficiary
employment dropped 10% compared to January 2015.
The broader seafood processing industry experienced a larger decrease in jobs.
Industry representatives stated that they find it increasingly difficult to hire and
retain employees in Washington's processing facilities.
In contrast to job losses in the seafood industry, employment grew by 10% in the food
manufacturing industry and by 7% statewide.
Exhibit 4.1: Seafood beneficiary jobs declined at a slower rate than the rest of the
seafood processing industry. At the same time, jobs grew statewide and in the food
manufacturing industry.
Source: JLARC staff analysis of Employment Security Department Quarterly Census of
Employment data for: Washington total employment, all covered employment; food
manufacturing industry employment, seafood product manufacturing industry employment,
and seafood beneficiary employment for Quarter 1, 2015, through Quarter 4, 2020.
Wages decreased by 4% among beneficiaries from 2015 to 2020, while average wages
increased statewide and in the food manufacturing industry
Seafood beneficiary wages decreased 4% from Quarter 1, 2015, through Quarter 4, 2020.
It is unclear why beneficiary wages fell while wages for other businesses grew. The
average wage for seafood beneficiaries in 2020 was $50,909.
Exhibit 4.2: Seafood beneficiary wages fell while wages increased 50% or more
statewide and in the food manufacturing industry
Source: JLARC staff analysis of Employment Security Department Quarterly Census of
Employment wage data for: Washington total covered, total wages, all covered
employees; food manufacturing industry wages; and seafood beneficiary wages for
Quarter 1, 2015 through Quarter 4, 2020.
Beneficiaries estimated to save $6.2 million in the 2021-23 biennium
JLARC staff estimated the future savings for seafood beneficiaries using actual
beneficiary data for calendar years 2015 through 2020.
JLARC staff estimated a compound average growth rateA method for expressing multi-year growth as a constant rate
of return over the time period. of 2.84% based on use of the
preference from 2015 through 2019. This rate was included in the estimate of future
use of the B&O exemption through its scheduled expiration on June 30, 2025.
Exhibit 4.3: Beneficiaries estimated to save $4.9 million in the 18 months before
the full B&O exemption expires
Biennium
Calendar Year
Estimated Beneficiary Savings
2019-2021
(July 1, 2019 - June 30, 2021)
2020
$2,879,000
2021
$2,961,000
2021-2023
(July 1, 2021 - June 30, 2023)
2022
$3,045,000
2023
$3,132,000
2023-2025
(July 1, 2023 - June 30, 2025)
2024
$3,221,000
2025
(thru 6/30/2025)
$1,656,000
Full exemption expires June 30, 2025. Beneficiaries will
pay a preferential B&O tax rate of 0.138% effective July 1,
2025.
Estimated 2023-2025 Biennial Savings
$ 4,877,000
Source: JLARC staff analysis of Department of Revenue Incentive and Reporting Public
Disclosure web page for seafood product B&O tax exemption and confidential tax
return detail. Future growth calculated using 2.84% compound average growth rate
determined by JLARC staff based on preference use from 2015-2019.
Beginning July 1, 2025, seafood beneficiaries will pay a preferential 0.138% B&O
tax rate for their qualifying manufacturing activities and for certain sales. The
general B&O rate for manufacturing and wholesaling activities is 0.484% and the
retailing rate is 0.471% . Under current law, the preferential rate does not expire.
Exhibit 4.4: Seafood beneficiaries estimated to save $5.1 million in the 2027-29
biennium using the preferential 0.138% rate
Biennium
Calendar Year
Estimated Beneficiary Savings
2025-27
(July 1, 2025 - June 30, 2027)
2025
(beginning 7/01/25)
$1,184,000
2026
$2,435,000
2027-29
(July 1, 2027 - June 30, 2029)
2027
$2,505,000
2028
$2,576,000
Estimated 2027-2029 biennial savings
$5,081,000
Source: JLARC staff estimate based on actual B&O exemption use per Department of
Revenue Incentive and Reporting Public Disclosure web page and confidential tax return
detail. Future growth calculated using 2.84% compound average growth rate determined
by JLARC staff based on actual preference use from 2015-2019.
Savings from the preference represented 0.68% of beneficiaries' total taxable
amount
The Legislature directed JLARC staff to answer the following two questions about
taxable income when it extended the B&O tax exemption in 2015:
1. What is the change in total taxable income for businesses claiming the
exemption?
The total taxable amountTotal B&O
tax gross receipts minus B&O tax deductions. reported on
Department of Revenue tax returns for seafood beneficiaries decreased from $482
million in 2016 to $454 million in 2019, a 5.8% decrease. The total taxable amount
increased from 2019 to 2020 by 5%.
2. What percentage of total taxable income does the exemption represent for
businesses claiming it?
The preference represents between 0.60% and 0.84% of the total taxable amount for
seafood beneficiaries between 2016 and 2020. The average over five years was
0.68%.
Preliminary Report: Food Processors
July 2022
Review Details
5. Preferences reduce taxes, but WA still has highest effective tax rate
The preferences provide tax relief, but Washington continues to
have a higher effective tax rate than neighboring states largely due to sales tax on
facility construction and maintenance.
JLARC staff hired a tax accounting consultant (Ernst & Young) to conduct a
comparative tax rate analysis for each of the three food processing industries in
Washington and in the neighboring competitor states of Oregon, Idaho, and California.
Industry representatives often cite these states as alternative locations for
Washington-based food processors to relocate. Alaska was also included in the seafood
processing industry analysis due to its significant national share of that industry.
Analysis looked at tax burdens on dairy, fruit & vegetable, and seafood
processors before and after state-based incentives were applied
The analysis compares estimates of the tax burdens for small and large hypothetical
food processing firms investing in new facilities in Washington and neighboring
competitor states. The analysis compares the impact of Washington's statutory
incentives with those provided by the other states.
The analysis calculated an effective tax rate for small and large hypothetical firms
that locate in each state prior to state-based incentives and after the incentives
were applied. An effective tax rate (ETR) is the percentage reduction in the
hypothetical firm's rate of return due to taxes over a 30-year period. The ETR
includes all state and local taxes a business might pay, including sales and use,
property, and B&O or income tax, as applicable.
Pre-incentive ETRs were calculated based on each state's particular tax structure.
Post-incentive ETRs were calculated after various state incentives were applied,
reducing the tax rate by some percentage.
For Washington, the pre-incentive rate for each industry was based on a scenario
where the current preference was not in effect. This meant that businesses paid the
general manufacturing B&O tax rate of 0.484%.
Conclusion: Preferences provide tax relief, but Washington continues to have
a higher effective tax rate than neighboring states
The consultants' analysis found that Washington's total state and local ETRs are the
highest among the neighboring competitor states for both small and large firms in all
three industries. This is true before the incentives are applied and after.
In each scenario, Ernst & Young noted a factor that significantly influenced the
results: Washington's relatively higher combined state and local sales tax, which
unlike some states applies to services for facility construction and ongoing facility
maintenance.
Dairy processors (NAICSNorth
American Industry Classification System. 3115)
In the small firm analysis, the preferences reduce the ETR from 36.7% to 31.8%.
The next closest post-incentive ETR is Idaho's at 18.5%.
In the large firm analysis, the preferences reduce the ETR from 27.2% to 22.8%.
The next closest post-incentive ETR is California's at 11.4%.
The analysis found that Idaho's low post-incentive ETR for large firms is due to
several incentives, including refundable income tax credits, property tax abatements,
and sales and use tax exemptions and refunds.
Exhibit 5.1: Washington's post-incentive ETR for dairy processors is 31.8% for small
firms and 22.8% for large firms
Source: JLARC staff analysis of Ernst & Young April 2022 report, page 7.
Fruit & vegetable processors (NAICSNorth American Industry Classification System. 3114)
The effective tax rate analysis addresses fruit & vegetable manufacturing
businesses under NAICS 3114. The study does not compare the effective tax rate for
wineries as an industry (NAICS 312130).
In the small firm analysis, the preferences reduce the ETR from 24.8% to 19.8%. The
closest post-incentive ETR is Idaho's at 17.3%. Oregon's small firm ETR does not
change with incentives because the hypothetical firm does not meet investment levels
for the state property tax incentives.
In the large firm analysis, the preferences reduce the ETR from 25.4% to 18.9%. The
closest post-incentive ETR is again Idaho's, at 11.4%. Idaho has the largest number of
incentives and the largest decline in total ETR for a large firm. But Idaho's higher
pre-incentive tax burden means even with a large decline, California's and Oregon's
ETRs are lower.
Exhibit 5.2: Washington's post-incentive ETR for fruit & vegetable processors is
19.8% for small firms and 18.9% for large firms
Source: JLARC staff analysis of Ernst & Young April 2022 report, page 6.
Seafood processors (NAICSNorth
American Industry Classification System. 3117)
In the small firm analysis, the preferences reduce the ETR from 27.8% to 21.2%.
The next closest post-incentive ETR is Alaska's at 15.9%.
In the large firm analysis, the preferences reduce the ETR from 53.0% to 39.9%.
The report notes that despite favorable sales and property taxes, Alaska has the
next highest post-incentive ETR at 30.8%. The report further notes across all five
states, the large seafood firm ETRs are double that of the small firm ETRs, due to
the relatively low profit margin for large seafood firms. The share of state and
local taxes has a higher relative impact due to the low net income of these
businesses.
Exhibit 5.3: Washington's post-incentive ETR for seafood processors is 21.2% for
small firms and 39.9% for large firms
Source: JLARC staff analysis of Ernst & Young April 2022 report, page 7.
Other factors besides taxes influence location decisions
Interviews with beneficiary businesses in all three industries indicated that taxes -
and the availability of tax incentives - are just one of many factors that influence
location decisions. Other factors noted by beneficiaries include:
Proximity to inputs, such as raw products and markets.
Labor availability and costs.
Transportation infrastructure.
Energy availability and costs.
Preliminary Report: Food Processors
July 2022
REVIEW Details
6. Job gains due to preferences likely offset by job losses in government sector
Economic modeling tool estimates the preferences likely increased
employment in the food processing industries, but the gains were more than offset by a
reduction in government employment.
JLARC staff used an economic modeling tool that predicts future impacts of a change,
such as removal of a tax preference. The estimated results highlight the potential
opportunity costs of the B&O tax preferences. See Appendix
D and Appendix
E for more details on the model and analysis.
Dairy processors: Estimated gain of 15 jobs in dairy and other industries would be
offset by expected loss of 49 jobs in state and local government
This scenario models the impacts of the current dairy processing B&O tax
exemption and the future 0.138% preferential B&O tax rate and an equivalent
government spending change. The results include direct, indirect, and induced
employment changes. The model estimates the impact over an 11-year period, from 2020
through 2031.
Overall, the model estimates that Washington would lose 34 jobs. A decrease in
government spending due to reduced tax revenues is estimated to result in a loss of 49
state and local government jobs, offsetting the gains in employment for dairy
manufacturing and other industries.
Exhibit 6.1: Preferences likely resulted in net loss of 34 jobs
Industry
Jobs added or lost
Dairy product manufacturing (NAICSNorth American Industry Classification
System. 3115)
+8
Other manufacturing
+4
Other private, nonfarm
+3
State and local government
-49
Total all industries
-34
Source: JLARC staff analysis of estimated future employment impacts using Regional
Economic Modeling Inc. (REMI) economic modeling tool.
Fruit & vegetable processors: Estimated gain of 62 jobs in fruit & vegetable
and other industries would be offset by expected loss of 141 jobs in government and
other private sector industries
This scenario models the impacts of the current fruit & vegetable processing
(NAICS 3114) B&O tax exemption and the future 0.138% preferential B&O tax rate
and an equivalent government spending change. The results include direct, indirect,
and induced employment changes. The model estimates the impact over an 11-year period,
from 2020 through 2031.
JLARC staff did not model the impact of a change in taxation to wineries as an
industry (NAICS 312130). This is because the level of detail necessary to conduct the
analysis is not included in the economic modeling tool. The model includes four-digit
NAICS codes, but does not provide detail for six-digit industry classifications.
Overall, the model estimates Washington would lose 79 jobs. A decrease in government
spending due to decreased tax revenues is estimated to result in a loss of 111 state
and local government jobs, and 30 additional private sector jobs. These losses offset
the estimated gains in manufacturing.
Exhibit 6.2: Preferences likely resulted in net loss of 79 jobs
Industry
Jobs added or lost
Fruit & vegetable manufacturing (NAICS 3114)
+57
Other manufacturing
+5
Other private, nonfarm
-30
State and local government
-111
Total all industries
-79
Source: JLARC staff analysis of estimated future employment impacts using Regional
Economic Modeling Inc. (REMI) economic modeling tool.
Seafood processors: Estimated gain of 15 jobs in seafood manufacturing and other
private industry would be offset by expected loss of 23 government sector jobs
This scenario models the current seafood products processing (NAICS 3117) B&O tax
exemption and the future preferential 0.138% B&O tax rate and an equivalent
government spending change. The results include direct, indirect, and induced
employment changes. The model estimates the impact over an 11-year period, from 2020
through 2031.
Overall, the model estimates Washington would lose eight jobs. A decrease in
government spending due to decreased tax revenues is estimated to result in a loss of
23 state and local government jobs, offsetting the gains in other industries.
Exhibit 6.3: Preferences likely resulted in a net loss of 8 jobs
Industry
Jobs added or lost
Seafood product preparation and packaging (NAICS 3117)
+13
Other manufacturing
0
Other private, nonfarm
+2
State and local government
-23
Total all industries
-8
Source: JLARC staff analysis of estimated future employment impacts using Regional
Economic Modeling Inc. (REMI) economic modeling tool. The other private, nonfarm job
gain is rounded down from 2.5 for estimating purposes.
Tax on manufacturers and processors of various foods and by - products—Research and
development organizations—Travel agents—Certain international activities— Stevedoring
and associated activities—Low-level waste disposers—Insurance producers, surplus line
brokers, and title insurance agents—Hospitals—Commercial airplane activities—Timber
product activities—Canned salmon processors.
RCW 82.04.260(a), (b), and (c)
*** CHANGE IN 2022 *** (SEE 1210-S2.SL) ***
(1) Upon every person engaging within this state in the business of
manufacturing:
(a) Wheat into flour, barley into pearl barley, soybeans into soybean oil, canola
into canola oil, canola meal, or canola by-products, or sunflower seeds into sunflower
oil; as to such persons the amount of tax with respect to such business is equal to
the value of the flour, pearl barley, oil, canola meal, or canola by-product
manufactured, multiplied by the rate of 0.138 percent;
(b) Beginning July 1, 2025, seafood products that remain in a raw, raw frozen, or raw
salted state at the completion of the manufacturing by that person; or selling
manufactured seafood products that remain in a raw, raw frozen, or raw salted state at
the completion of the manufacturing, to purchasers who transport in the ordinary
course of business the goods out of this state; as to such persons the amount of tax
with respect to such business is equal to the value of the products manufactured or
the gross proceeds derived from such sales, multiplied by the rate of 0.138 percent.
Sellers must keep and preserve records for the period required by RCW 82.32.070
establishing that the goods were transported by the purchaser in the ordinary course
of business out of this state;
(c)(i) Except as provided otherwise in (c)(iii) of this subsection, from July 1,
2025, until January 1, 2036, dairy products; or selling dairy products that the person
has manufactured to purchasers who either transport in the ordinary course of business
the goods out of state or purchasers who use such dairy products as an ingredient or
component in the manufacturing of a dairy product; as to such persons the tax imposed
is equal to the value of the products manufactured or the gross proceeds derived from
such sales multiplied by the rate of 0.138 percent. Sellers must keep and preserve
records for the period required by RCW 82.32.070 establishing that the goods were
transported by the purchaser in the ordinary course of business out of this state or
sold to a manufacturer for use as an ingredient or component in the manufacturing of a
dairy product.
(ii) For the purposes of this subsection (1)(c), "dairy products" means:
(A) Products, not including any marijuana-infused product, that as of September 20,
2001, are identified in 21 C.F.R., chapter 1, parts 131, 133, and 135, including
by-products from the manufacturing of the dairy products, such as whey and casein;
and
(B) Products comprised of not less than seventy percent dairy products that qualify
under (c)(ii)(A) of this subsection, measured by weight or volume.
(iii) The preferential tax rate provided to taxpayers under this subsection (1)(c)
does not apply to sales of dairy products on or after July 1, 2023, where a dairy
product is used by the purchaser as an ingredient or component in the manufacturing in
Washington of a dairy product;
(d)(i) Beginning July 1, 2025, fruits or vegetables by canning, preserving, freezing,
processing, or dehydrating fresh fruits or vegetables, or selling at wholesale fruits
or vegetables manufactured by the seller by canning, preserving, freezing, processing,
or dehydrating fresh fruits or vegetables and sold to purchasers who transport in the
ordinary course of business the goods out of this state; as to such persons the amount
of tax with respect to such business is equal to the value of the products
manufactured or the gross proceeds derived from such sales multiplied by the rate of
0.138 percent. Sellers must keep and preserve records for the period required by RCW
82.32.070 establishing that the goods were transported by the purchaser in the
ordinary course of business out of this state.
(ii) For purposes of this subsection (1)(d), "fruits" and "vegetables" do not include
marijuana, useable marijuana, or marijuana-infused products;
(JLARC note: The remainder of the statute is not shown, as it does not apply to
the preferences currently under review.)
[ 2021 c 145 § 7; 2020 c 165 § 3. Prior: 2019 c 425 § 1; 2019 c 336 § 4; 2018 c 164 §
3; 2017 c 135 § 11; prior: 2015 3rd sp.s. c 6 § 602; 2015 3rd sp.s. c 6 § 205; prior:
2014 c 140 § 6; (2014 c 140 § 5 expired July 1, 2015); 2014 c 140 § 4; (2014 c 140 § 3
expired July 1, 2015); 2013 3rd sp.s. c 2 § 6; (2013 3rd sp.s. c 2 § 5 expired July 1,
2015); 2013 2nd sp.s. c 13 § 203; (2013 2nd sp.s. c 13 § 202 expired July 1, 2015);
prior: (2012 2nd sp.s. c 6 § 602 expired July 1, 2015); 2012 2nd sp.s. c 6 § 204; 2011
c 2 § 203 (Initiative Measure No. 1107, approved November 2, 2010); 2010 1st sp.s. c
23 § 506; (2010 1st sp.s. c 23 § 505 expired June 10, 2010); 2010 c 114 § 107; prior:
2009 c 479 § 64; 2009 c 461 § 1; 2009 c 162 § 34; prior: 2008 c 296 § 1; 2008 c 217 §
100; 2008 c 81 § 4; prior: 2007 c 54 § 6; 2007 c 48 § 2; prior: 2006 c 354 § 4; 2006 c
300 § 1; prior: 2005 c 513 § 2; 2005 c 443 § 4; prior: 2003 2nd sp.s. c 1 § 4; 2003
2nd sp.s. c 1 § 3; 2003 c 339 § 11; 2003 c 261 § 11; 2001 2nd sp.s. c 25 § 2; prior:
1998 c 312 § 5; 1998 c 311 § 2; prior: 1998 c 170 § 4; 1996 c 148 § 2; 1996 c 115 § 1;
prior: 1995 2nd sp.s. c 12 § 1; 1995 2nd sp.s. c 6 § 1; 1993 sp.s. c 25 § 104; 1993 c
492 § 304; 1991 c 272 § 15; 1990 c 21 § 2; 1987 c 139 § 1; prior: 1985 c 471 § 1; 1985
c 135 § 2; 1983 2nd ex.s. c 3 § 5; prior: 1983 1st ex.s. c 66 § 4; 1983 1st ex.s. c 55
§ 4; 1982 2nd ex.s. c 13 § 1; 1982 c 10 § 16; prior: 1981 c 178 § 1; 1981 c 172 § 3;
1979 ex.s. c 196 § 2; 1975 1st ex.s. c 291 § 7; 1971 ex.s. c 281 § 5; 1971 ex.s. c 186
§ 3; 1969 ex.s. c 262 § 36; 1967 ex.s. c 149 § 10; 1965 ex.s. c 173 § 6; 1961 c 15 §
82.04.260; prior: 1959 c 211 § 2; 1955 c 389 § 46; prior: 1953 c 91 § 4; 1951 2nd
ex.s. c 28 § 4; 1950 ex.s. c 5 § 1, part; 1949 c 228 § 1, part; 1943 c 156 § 1, part;
1941 c 178 § 1, part; 1939 c 225 § 1, part; 1937 c 227 § 1, part; 1935 c 180 § 4,
part; Rem. Supp. 1949 § 8370-4, part.]
NOTES:
Findings—Intent—Effective date—2020 c 165: See notes following RCW
82.04.2602.
Effective date—2019 c 425: "This act is necessary for the immediate
preservation of the public peace, health, or safety, or support of the state
government and its existing public institutions, and takes effect July 1, 2019." [
2019 c 425 § 2.]
Findings—Intent—2019 c 336: See notes following RCW 82.04.261.
Tax preference performance statement—Effective date—2018 c 164: See notes
following RCW 82.08.900.
Effective date—2017 c 135: See note following RCW 82.32.534.
Expiration date—2015 3rd sp.s. c 6; 2012 2nd sp.s. c 6 § 602: "Section 602 of
this act expires July 1, 2015." [ 2015 3rd sp.s. c 6 § 603; 2012 2nd sp.s. c 6 §
704.]
Findings—Intent—Tax preference performance statement—2015 3rd sp.s. c 6 § 602:
"(1) The legislature finds that over the last fifteen years, technological
transformation and other developments have radically changed the newspaper industry
business model, which remains in transition. The legislature further finds that the
economic hardship wrought by this digital transformation has been substantial. The
legislature finds that a strong and vibrant newspaper industry in Washington is
beneficial to the state's citizens and to the conduct of good government at every
level. The legislature further finds that advertising revenue of all United States
newspapers fell from 63.5 billion dollars in 2000 to about twenty-three billion
dollars in 2013, and is still falling. The legislature further finds that traditional
news organizations' ability to support high quality news gathering and reporting
relied primarily on a model in which advertisers paid to reach mass audiences
attracted by newspapers. The legislature further finds that advertisers found it
advantageous to pay to reach a mass audience because other advertising mediums were
limited and less effective. The digital era has greatly fractured traditional spending
by advertisers and turned this model on its head such that newspapers continue to
require time to adapt so they may continue their public service mission. The
legislature also finds that the business and occupation tax rate for the newspaper
industry was pegged to the general manufacturing and wholesaling rate from 1937 until
2009, when the legislature extended tax relief to the industry due to this shift. It
is the legislature's intent to extend this tax relief to the industry until its
revenues and business model have stabilized. It is the legislature's further intent to
provide a uniform tax rate for the industry to minimize the burden of reporting state
business and occupation taxes for different types of revenue, which oftentimes are
impossible to account for separately by the taxpayer.
(2)(a) This subsection is the tax preference performance statement for the newspaper
tax preferences in section 602 of this act. The performance statement is only intended
to be used for subsequent evaluation of the tax preference. It is not intended to
create a private right of action by any party or be used to determine eligibility for
preferential tax treatment.
(b) The legislature categorizes this tax preference as one intended to provide
temporary tax relief as described in RCW 82.32.808(2)(e).
(c) It is the legislature's specific public policy objective to provide business and
occupation tax relief to the newspaper industry as it continues to adjust to
significant revenue shifts and technological changes. As a secondary public policy
objective, it is the legislature's intent to provide a permanent uniform rate for the
industry.
(d) To measure the effectiveness of the preference provided in this act in achieving
the specific public policy objective described in (c) of this subsection, the joint
legislative audit and review committee must evaluate year-to-year changes in gross
revenue derived from all sources for newspaper firms claiming the preferential tax
rate under RCW 82.04.260(14). If the average year-to-year change in gross revenue is
positive, including the last three years included in the tax preference review by the
joint legislative audit and review committee, it is the legislature's intent to allow
the tax preference to expire and to reinstate the traditional rate of 0.484
percent.
(e)(i) The information provided in the annual tax preference accountability report
submitted by taxpayers as required by the department of revenue and taxpayer data
provided by the department of revenue is intended to provide the informational basis
for the evaluation under (d) of this subsection.(ii) In addition to the data source
described under (e)(i) of this subsection, the joint legislative audit and review
committee may use any other data it deems necessary in performing the evaluation under
(d) of this subsection." [ 2015 3rd sp.s. c 6 § 601.]
Effective dates—2015 3rd sp.s. c 6: See note following RCW 82.04.4266.
Tax preference performance statement—2015 3rd sp.s. c 6 §§ 202-205: See note
following RCW 82.04.4266.
Contingent effective date—2014 c 140 § 6: "Section 6 of this act takes effect
July 1, 2015, subject to the contingency stated in section 2, chapter 2, Laws of 2013
3rd sp. sess." [ 2014 c 140 § 39.]
Contingent expiration date—2014 c 140 § 5: "Section 5 of this act expires July
1, 2015, subject to the contingency stated in section 2, chapter 2, Laws of 2013 3rd
sp. sess." [ 2014 c 140 § 38.]
Effective date—2014 c 140 § 4: "Section 4 of this act takes effect July 1,
2015." [ 2014 c 140 § 37.]
Expiration date—2014 c 140 § 3: "Section 3 of this act expires July 1, 2015."
[ 2014 c 140 § 36.]
Effective date—2013 3rd sp.s. c 2 § 6: "Subject to section 2 of this act,
section 6 of this act takes effect July 1, 2015." [ 2013 3rd sp.s. c 2 § 16.]
Expiration date—2013 3rd sp.s. c 2 § 5: "Subject to section 2 of this act,
section 5 of this act expires July 1, 2015." [ 2013 3rd sp.s. c 2 § 15.]
Contingent effective date—2013 3rd sp.s. c 2: See RCW
82.32.850.Findings—Intent—2013 3rd sp.s. c 2: See note following RCW 82.32.850.
Effective date—2013 2nd sp.s. c 13 § 203: "Section 203 of this act takes
effect July 1, 2015." [ 2013 2nd sp.s. c 13 § 1902.]
Expiration date—2013 2nd sp.s. c 13 § 202: "Section 202 of this act expires
July 1, 2015." [ 2013 2nd sp.s. c 13 § 1901.]
Intent—2013 2nd sp.s. c 13: "The intent of part II of this act is to
incentivize the creation of additional jobs in Washington in the dairy industry and
related industries that manufacture dairy-based products. More specifically, it is the
intent of part II of this act to encourage infant formula producers to locate new
facilities in Washington or expand existing facilities in Washington through an
extension of a preferential business and occupation tax rate for dairy producers. It
is the further intent of the legislature to provide this tax incentive in a fiscally
responsible manner where the actual revenue impact of the legislation substantially
conforms with the fiscal estimate provided in the legislation's fiscal note." [ 2013
2nd sp.s. c 13 § 201.]
Effective date—2013 2nd sp.s. c 13: See note following RCW 82.04.43393.
Existing rights, liabilities, or obligations—Effective dates—Contingent effective
dates—2012 2nd sp.s. c 6: See notes following RCW 82.04.29005.
Findings—Construction—2011 c 2 (Initiative Measure No. 1107): See notes
following RCW 82.08.0293.
Expiration date—2010 1st sp.s. c 23 §§ 503, 505, and 514: See note following
RCW 82.04.4266.
Effective date—2010 1st sp.s. c 23 §§ 504, 506, and 515: See note following
RCW 82.04.4266.
Findings—Intent—2010 1st sp.s. c 23: See notes following RCW 82.04.220.
Effective date—2010 1st sp.s. c 23: See note following RCW 82.04.4292.
Application—Finding—Intent—2010 c 114: See notes following RCW 82.32.534.
Effective date—2009 c 479: See note following RCW 2.56.030.
Effective date—Contingent effective date—2009 c 461: See note following RCW
82.04.280.
Effective date—2009 c 162: See note following RCW 48.03.020.
Retroactive application—2008 c 296: "Section 1 of this act applies
retroactively to July 1, 2007, as well as prospectively." [ 2008 c 296 § 2.]
Severability—Effective date—2008 c 217: See notes following RCW 48.03.020.
Findings—Savings—Effective date—2008 c 81: See notes following RCW
82.08.975.
Severability—2007 c 54: See note following RCW 82.04.050.
Effective date—2007 c 48: "This act is necessary for the immediate
preservation of the public peace, health, or safety, or support of the state
government and its existing public institutions, and takes effect July 1, 2007." [
2007 c 48 § 9.]
Effective dates—2006 c 354: See note following RCW 82.04.4268.
Effective dates—Contingent effective date—2006 c 300: See note following RCW
82.04.261.
Effective dates—2005 c 513: See note following RCW 82.04.4266.
Finding—Intent—Effective date—2005 c 443: See notes following RCW
82.08.0255.
Finding—2003 2nd sp.s. c 1: See note following RCW 82.04.4461.
Effective dates—2003 c 339: See note following RCW 84.36.640.
Effective dates—2003 c 261: See note following RCW 84.36.635.
Purpose—Intent—2001 2nd sp.s. c 25: "The purpose of sections 2 and 3 of this
act is to provide a tax rate for persons who manufacture dairy products that is
commensurate to the rate imposed on certain other processors of agricultural
commodities. This tax rate applies to persons who manufacture dairy products from raw
materials such as fluid milk, dehydrated milk, or by-products of milk such as cream,
buttermilk, whey, butter, or casein. It is not the intent of the legislature to
provide this tax rate to persons who use dairy products as an ingredient or component
of their manufactured product, such as milk-based soups or pizza. It is the intent
that persons who manufacture products such as milk, cheese, yogurt, ice cream, whey,
or whey products be subject to this rate." [ 2001 2nd sp.s. c 25 § 1.]
Part headings not law—2001 2nd sp.s. c 25: "Part headings used in this act are
not any part of the law." [ 2001 2nd sp.s. c 25 § 7.]
Effective date—Savings—1998 c 312: See notes following RCW 82.04.332.
Effective date—1998 c 170: See note following RCW 82.04.331.
Severability—Effective date—1996 c 148: See notes following RCW 82.04.050.
Effective date—1996 c 115: "This act shall take effect July 1, 1996." [ 1996 c
115 § 2.]
Effective date—1995 2nd sp.s. c 12: "This act is necessary for the immediate
preservation of the public peace, health, or safety, or support of the state
government and its existing public institutions, and shall take effect July 1, 1995."
[ 1995 2nd sp.s. c 12 § 2.]
Effective date—1995 2nd sp.s. c 6: "This act is necessary for the immediate
preservation of the public peace, health, or safety, or support of the state
government and its existing public institutions, and shall take effect July 1, 1995."
[ 1995 2nd sp.s. c 6 § 2.]
Severability—Effective dates—Part headings, captions not law—1993 sp.s. c 25:
See notes following RCW 82.04.230.
Findings—Intent—1993 c 492: See notes following RCW 43.20.050.
Short title—Savings—Reservation of legislative power—Effective dates—1993 c 492:
See RCW 43.72.910 through 43.72.915.
Effective dates—1991 c 272: See RCW 81.108.901.
Severability—1985 c 471: "If any provision of this act or its application to
any person or circumstance is held invalid, the remainder of the act or the
application of the provision to other persons or circumstances is not affected." [
1985 c 471 § 17.]
Effective date—1985 c 471: "This act is necessary for the immediate
preservation of the public peace, health, and safety, the support of the state
government and its existing public institutions, and shall take effect July 1, 1985."
[ 1985 c 471 § 18.]
Construction—Severability—Effective dates—1983 2nd ex.s. c 3: See notes
following RCW 82.04.255.
Effective dates—1983 1st ex.s. c 55: See note following RCW 82.08.010.
Severability—1982 2nd ex.s. c 13: "If any provision of this act or its
application to any person or circumstance is held invalid, the remainder of the act or
the application of the provision to other persons or circumstances is not affected." [
1982 2nd ex.s. c 13 § 2.]
Effective date—1982 2nd ex.s. c 13: "This act is necessary for the immediate
preservation of the public peace, health, and safety, the support of the state
government and its existing public institutions, and shall take effect August 1,
1982." [ 1982 2nd ex.s. c 13 § 3.]
Severability—1982 c 10: See note following RCW 6.13.080.
Effective dates—1981 c 172: See note following RCW 82.04.240.
Effective date—1979 ex.s. c 196: See note following RCW 82.04.240.
Effective dates—Severability—1975 1st ex.s. c 291: See notes following RCW
82.04.050.
Effective date—1971 ex.s. c 186: See note following RCW 82.04.110.
Exemptions—Fruit & vegetable businesses. (Expires July 1, 2025.)
RCW 82.04.4266
*** CHANGE IN 2022 *** (SEE 1210-S2.SL) ***
(1) This chapter does not apply to the value of products or the gross proceeds of
sales derived from:
(a) Manufacturing fruits or vegetables by canning, preserving, freezing, processing,
or dehydrating fresh fruits or vegetables; or
(b) Selling at wholesale fruits or vegetables manufactured by the seller by canning,
preserving, freezing, processing, or dehydrating fresh fruits or vegetables and sold
to purchasers who transport in the ordinary course of business the goods out of this
state. A person taking an exemption under this subsection (1)(b) must keep and
preserve records for the period required by RCW 82.32.070 establishing that the goods
were transported by the purchaser in the ordinary course of business out of this
state.
(2) For purposes of this section, "fruits" and "vegetables" do not include marijuana,
useable marijuana, or marijuana-infused products.
(3) A person claiming the exemption provided in this section must file a complete
annual tax performance report with the department under RCW 82.32.534.
(4) This section expires July 1, 2025.
[ 2020 c 139 § 5; 2015 3rd sp.s. c 6 § 202; 2014 c 140 § 9; 2012 2nd sp.s. c 6 § 201;
2011 c 2 § 202 (Initiative Measure No. 1107, approved November 2, 2010); 2010 1st
sp.s. c 23 § 504; (2010 1st sp.s. c 23 § 503 expired June 10, 2010); 2010 c 114 § 111;
2006 c 354 § 3; 2005 c 513 § 1.]
NOTES:
Effective dates—2020 c 272; 2017 c 323; 2015 3rd sp.s. c 6: "(1) Except as
provided otherwise in this part, this act is necessary for the immediate preservation
of the public peace, health, or safety, or support of the state government and its
existing public institutions, and takes effect July 1, 2015.
(2) Parts IV, VI, VIII, and XIX of this act are necessary for the immediate
preservation of the public peace, health, or safety, or support of the state
government and its existing public institutions, and take effect September 1,
2015.
(3) Part X of this act takes effect October 1, 2016.
(4) Section 1105 of this act takes effect January 1, 2016.
(5) Except for section 2004 of this act, Part XX of this act takes effect January 1,
2019." [ 2020 c 272 § 5; 2017 c 323 § 301; 2015 3rd sp.s. c 6 § 2301.]
Tax preference performance statement—2015 3rd sp.s. c 6 §§ 202-205: "This
section is the tax preference performance statement for the agricultural processor tax
exemptions in sections 202 through 205 of this act. The performance statement is only
intended to be used for subsequent evaluation of the tax preference. It is not
intended to create a private right of action by any party or be used to determine
eligibility for preferential tax treatment.
(1) The legislature categorizes this tax preference as one intended to accomplish the
general purposes indicated in RCW 82.32.808(2) (c) and (e).
(2) It is the legislature's specific public policy objective to create and retain
jobs and continue providing tax relief to the food processing industry.
(3) To measure the effectiveness of the exemptions in sections 202 through 205 of
this act in achieving the public policy objectives described in subsection (2) of this
section, the joint legislative audit and review committee must evaluate the
following:(a) The number of businesses that claim the exemptions in sections 202
through 205 of this act;(b) The change in total taxable income for taxpayers claiming
the exemptions under sections 202 through 205 of this act;(c) The change in total
employment for taxpayers claiming the exemptions under sections 202 through 205 of
this act; and(d) For each calendar year, the total amount of exemptions claimed under
sections 202 through 205 of this act as a percentage of total taxable income for
taxpayers within taxable income categories.
(4) The information provided in the annual survey submitted by the taxpayers under
*RCW 82.32.585, tax data collected by the department of revenue, and data collected by
the employment security department is intended to provide the informational basis for
the evaluation under subsection (3) of this section.
(5) In addition to the data sources described under subsection (4) of this section,
the joint legislative audit and review committee may use any other data it deems
necessary in performing the evaluation under subsection (3) of this section." [ 2015
3rd sp.s. c 6 § 201.]
*Reviser's note: RCW 82.32.585 was repealed by 2017 c 135 § 2, effective
January 1, 2018.
Existing rights, liabilities, or obligations—Effective dates—Contingent effective
dates—2012 2nd sp.s. c 6: See notes following RCW 82.04.29005.
Findings—Construction—2011 c 2 (Initiative Measure No. 1107): See notes
following RCW 82.08.0293.
Expiration date—2010 1st sp.s. c 23 §§ 503, 505, and 514: "Sections 503, 505,
and 514 of this act expire June 10, 2010." [ 2010 1st sp.s. c 23 § 1711.]
Effective date—2010 1st sp.s. c 23 §§ 504, 506, and 515: "Sections 504, 506,
and 515 of this act are necessary for the immediate preservation of the public peace,
health, or safety, or support of the state government and its existing public
institutions, and take effect June 10, 2010." [ 2010 1st sp.s. c 23 § 1712.]
Findings—Intent—2010 1st sp.s. c 23: See notes following RCW 82.04.220.
Effective date—2010 1st sp.s. c 23: See note following RCW 82.04.4292.
Application—Finding—Intent—2010 c 114: See notes following RCW 82.32.534.
Effective dates—2006 c 354: See note following RCW 82.04.4268.
Effective dates—2005 c 513: "This act takes effect July 1, 2007, except for
sections 1 through 3 of this act which are necessary for the immediate preservation of
the public peace, health, or safety, or support of the state government and its
existing public institutions, and take effect July 1, 2005, and section 5, chapter
513, Laws of 2005, which takes effect April 30, 2007." [ 2007 c 243 § 1; 2005 c 513 §
14.]
Exemptions—Dairy product businesses. (Expires July 1, 2025.)
RCW 82.04.4268
(1) In computing tax there may be deducted from the measure of tax, the value of
products or the gross proceeds of sales derived from:
(a) Manufacturing dairy products; or
(b) Selling dairy products manufactured by the seller to purchasers who either
transport in the ordinary course of business the goods out of this state or purchasers
who use such dairy products as an ingredient or component in the manufacturing of a
dairy product. A person taking an exemption under this subsection (1)(b) must keep and
preserve records for the period required by RCW 82.32.070 establishing that the goods
were transported by the purchaser in the ordinary course of business out of this state
or sold to a manufacturer for use as an ingredient or component in the manufacturing
of a dairy product.
(2) "Dairy products" has the same meaning as provided in RCW 82.04.260.
(3) A person claiming the exemption provided in this section must file a complete
annual tax performance report with the department under RCW 82.32.534.
(4) This section expires July 1, 2025.
[ 2020 c 139 § 6; 2015 3rd sp.s. c 6 § 203; 2013 2nd sp.s. c 13 § 204; 2012 2nd sp.s.
c 6 § 202; 2010 c 114 § 112; 2006 c 354 § 1.]
NOTES:
Effective dates—2015 3rd sp.s. c 6: See note following RCW 82.04.4266.
Tax preference performance statement—2015 3rd sp.s. c 6 §§ 202-205: See note
following RCW 82.04.4266.
Intent—2013 2nd sp.s. c 13: See note following RCW 82.04.260.
Effective date—2013 2nd sp.s. c 13: See note following RCW 82.04.43393.
Exemptions—Seafood product businesses. (Expires July 1, 2025.)
RCW 82.04.4269
(1) This chapter does not apply to the value of products or the gross proceeds of
sales derived from:
(a) Manufacturing seafood products that remain in a raw, raw frozen, or raw salted
state at the completion of the manufacturing by that person; or
(b) Selling manufactured seafood products that remain in a raw, raw frozen, or raw
salted state to purchasers who transport in the ordinary course of business the goods
out of this state. A person taking an exemption under this subsection (1)(b) must keep
and preserve records for the period required by RCW 82.32.070 establishing that the
goods were transported by the purchaser in the ordinary course of business out of this
state.
(2) A person claiming the exemption provided in this section must file a complete
annual tax performance report with the department under RCW 82.32.534.
(3) This section expires July 1, 2025.
[ 2020 c 139 § 7; 2015 3rd sp.s. c 6 § 204; 2012 2nd sp.s. c 6 § 203; 2010 c 114 §
113; 2006 c 354 § 2.]
NOTES:
Effective dates—2015 3rd sp.s. c 6: See note following RCW 82.04.4266.
Tax preference performance statement—2015 3rd sp.s. c 6 §§ 202-205: See note
following RCW 82.04.4266.
Existing rights, liabilities, or obligations—Effective dates—Contingent effective
dates—2012 2nd sp.s. c 6: See notes following RCW 82.04.29005.
Application—Finding—Intent—2010 c 114: See notes following RCW 82.32.534.
Effective dates—2006 c 354: See note following RCW 82.04.4268.
Annual report requirement for tax preferences.
RCW 82.32.534
*** CHANGE IN 2022 *** (SEE 5800.SL) ***
(1)(a)(i) Beginning in calendar year 2018, every person claiming a tax preference
that requires an annual tax performance report under this section must file a complete
annual report with the department. The report is due by May 31st of the year following
any calendar year in which a person becomes eligible to claim the tax preference that
requires a report under this section.
(ii) If the tax preference is a deferral of tax, the first annual tax performance
report must be filed by May 31st of the calendar year following the calendar year in
which the investment project is certified by the department as operationally complete,
and an annual tax performance report must be filed by May 31st of each of the seven
succeeding calendar years.
(iii) The department may extend the due date for timely filing of annual reports
under this section as provided in RCW 82.32.590.
(b) The report must include information detailing employment and wages for employment
positions in Washington for the year that the tax preference was claimed. However,
persons engaged in manufacturing commercial airplanes or components of such airplanes
may report employment and wage information per job at the manufacturing site for the
year that the tax preference was claimed. The report must not include names of
employees. The report must also detail employment by the total number of full-time,
part-time, and temporary positions for the year that the tax preference was claimed.
In lieu of reporting employment and wage data required under this subsection,
taxpayers may instead opt to allow the employment security department to release the
same employment and wage information from unemployment insurance records to the
department and the joint legislative audit and review committee. This option is
intended to reduce the reporting burden for taxpayers, and each taxpayer electing to
use this option must affirm that election in accordance with procedures approved by
the employment security department.
(c) Persons receiving the benefit of the tax preference provided by RCW 82.16.0421 or
claiming any of the tax preferences provided by RCW 82.04.2909, 82.04.4481, 82.08.805,
82.12.805, or 82.12.022(5) must indicate on the annual report the quantity of product
produced in this state during the time period covered by the report.
(d) If a person filing a report under this section did not file a report with the
department in the previous calendar year, the report filed under this section must
also include employment and wage information for the calendar year immediately
preceding the calendar year for which a tax preference was claimed.
(2)(a) As part of the annual report, the department and the joint legislative audit
and review committee may request additional information necessary to measure the
results of, or determine eligibility for, the tax preference.
(b) The report must include the amount of the tax preference claimed for the calendar
year covered by the report. For a person that claimed an exemption provided in RCW
82.08.025651 or 82.12.025651, the report must include the amount of tax exempted under
those sections in the prior calendar year for each general area or category of
research and development for which exempt machinery and equipment and labor and
services were acquired in the prior calendar year.
(3) Other than information requested under subsection (2)(a) of this section, the
information contained in an annual report filed under this section is not subject to
the confidentiality provisions of RCW 82.32.330 and may be disclosed to the public
upon request.
(4)(a) Except as otherwise provided by law, if a person claims a tax preference that
requires an annual report under this section but fails to submit a complete report by
the due date or any extension under RCW 82.32.590, the department must declare:
(i) Thirty-five percent of the amount of the tax preference claimed for the previous
calendar year to be immediately due and payable;
(ii) An additional fifteen percent of the amount of the tax preference claimed for
the previous calendar year to be immediately due and payable if the person has
previously been assessed under this subsection (4) for failure to submit a report
under this section for the same tax preference; and
(iii) If the tax preference is a deferral of tax, the amount immediately due under
this subsection is twelve and one-half percent of the deferred tax. If the economic
benefits of the deferral are passed to a lessee, the lessee is responsible for payment
to the extent the lessee has received the economic benefit.
(b) The department may not assess interest or penalties on amounts due under this
subsection.
(5) The department must use the information from this section to prepare summary
descriptive statistics by category. No fewer than three taxpayers may be included in
any category. The department must report these statistics to the legislature each year
by December 31st.
(6) For the purposes of this section:(a) "Person" has the meaning provided in RCW
82.04.030 and also includes the state and its departments and institutions.
(b) "Tax preference" has the meaning provided in RCW 43.136.021 and includes only the
tax preferences requiring a report under this section.
[ 2021 c 145 § 19; 2017 c 135 § 1; 2016 c 175 § 1; 2014 c 97 § 102; 2010 c 114 §
103.]
NOTES:
Effective date—2017 c 135: "This act takes effect January 1, 2018." [ 2017 c
135 § 48.]
Effective date—2016 c 175: "This act takes effect July 1, 2016." [ 2016 c 175
§ 4.]
Application—Prospective and retroactive—2016 c 175: "(1) In addition to
applying prospectively, sections 1(4) and 2(6) of this act apply retroactively for a
taxpayer who has filed an appeal regarding taxes, penalties, and interest owed under
RCW 82.32.534 or * 82.32.585 before January 1, 2016, and the appeal is pending before
the department of revenue or the board of tax appeals as of July 1, 2016.(2) Except
for taxpayers described in subsection (1) of this section, sections 1(4) and 2(6) of
this act apply to amounts due and payable under sections 1(4) and 2(6) of this act on
or after July 1, 2017." [ 2016 c 175 § 3.]
*Reviser's note: RCW 82.32.585 was repealed by 2017 c 135 § 2, effective
January 1, 2018.
Annual surveys and reports—Recommendations to update and improve—2013 2nd sp.s. c
13: "By December 1, 2013, the department of revenue, in consultation with the
joint legislative audit and review committee, must make recommendations to the
appropriate fiscal committees of the legislature on ways to update and improve the
annual report and annual survey. The recommendations must include suggested revisions
to the report and survey that would make the data more relevant and reduce the
administrative burden on the taxpayer." [ 2013 2nd sp.s. c 13 § 1801.]
Application—2010 c 114: "Those provisions of sections 101 through 103, 105
through 109, 111 through 116, 118 through 122, 124, 126 through 128, 130, 132 through
149, and 151 through 153 of this act that relate to annual surveys and annual reports
apply beginning with annual surveys and annual reports due in 2011 and thereafter." [
2010 c 114 § 203.]
Finding—Intent—2010 c 114: "(1) The legislature finds that accountability and
effectiveness are important aspects of setting tax policy. In order to make policy
choices regarding the best use of limited state resources, the legislature needs
information on how a tax preference is used. In recent years, the legislature has
enacted or extended numerous tax preferences that require the reporting of information
to the department of revenue. Although there are many similarities in the
requirements, and only two distinct accountability documents, there is a lack of
uniformity in the information reported, penalties for failure to file, due dates,
filing extensions, and filing requirements. Greater uniformity in the data reported is
necessary to adequately compare tax preference programs. The legislature intends to
create two sets of uniform reporting requirements that apply to the existing tax
preferences and can be used in future legislation granting additional tax
preferences.
(2) The legislative fiscal committees or the department of revenue are required to
study many of the existing tax preferences and report to the legislature at least
once. Because chapter 43.136 RCW now requires the joint legislative audit and review
committee, with support from the department of revenue, to comprehensively review most
tax preferences every ten years and provide a report to the legislature, a number of
redundant studies by the legislative fiscal committees and the department of revenue
have been eliminated. However, the department of revenue will continue to prepare
summary descriptive statistics by category and report the statistics to the
legislature each year." [ 2010 c 114 § 101.]
Preliminary Report: Food Processors
July 2022
Review Details
Appendix A: Dairy beneficiaries
Dairy product beneficiaries and their tax savings: 2015-2020
This table reflects all businesses that used the dairy product processing B&O tax
deduction and filed an Annual Tax Performance Report in any year from 2015 through
2020. This detail is publicly disclosable per RCW 82.32.534(3). The yearly totals may
differ from the amounts listed for beneficiary savings totals in Section
2 because those totals may include businesses that did not file Annual Reports
with the Department of Revenue (DOR).
Exhibit A1: Dairy beneficiaries, 2015-2020
DOR Account No.
Business Name
2015 Preference Value
2016 Preference Value
2017 Preference Value
2018 Preference Value
2019 Preference Value
2020 Preference Value
603520031
100979 LLC
-
-
-
$0
-
-
600176354
ANDERSEN DAIRY, INC.
$137,661
$78,379
$132,523
$89,379
$71,292
$70,548
601592929
APPEL FARMS, L.L.C.
ND
$14,128
ND
$9,520
$9,949
$9,676
171000095
AUBURN DAIRY PRODUCTS, INC.
-
$235,847
$241,405
$247,566
$211,438
$213,725
602269023
BEECHER'S HANDMADE CHEESE LLC
-
-
-
$13,830
$11,794
$11,153
602965580
BURTON HILL FARM, LLC
-
-
$5
-
-
-
603396541
CASCADIA CREAMERY LLC
-
$2,183
$2,466
$3,118
$3,210
$2,614
602676133
CHERRY VALLEY DAIRY LLC
$237
$338
$427
$484
$702
$533
602025735
COUNTRY MORNING FARMS, INC.
$25,397
$54,900
$39,232
$40,087
$50,811
$46,060
178005035
DARIGOLD, INC.
$3,811,628
$3,613,656
$3,958,886
$4,007,598
$4,722,771
$4,539,662
601610139
EDALEEN DAIRY, L.L.C.
-
$15,911
$15,233
$16,848
$22,730
$20,697
603120419
FERNDALE FARMSTEAD, LLC
-
$1,425
$1,818
-
-
$3,406
600164727
FLOYD PETERSON COMPANY
$24,200
$25,410
$46,552
$58,580
$68,822
$16,815
603239975
FLYING COW CREAMERY LLC
-
-
-
$0
-
-
602990711
FRISIA DAIRY & CREAMERY LLC
$1,434
$1,443
-
-
-
-
603436995
GOLDEN GLEN CREAMERY, LLC
-
-
ND
$21
-
-
603011163
GONZALEZ-ORTEGA, TANIA ELENA
-
$75
$749
$8
$44
$123
603585907
HARBOR HOME FARM LLC
-
-
ND
-
-
-
602991207
HERON POND FARMS LLC
-
$57
ND
$5
-
-
603176735
ICE CREAM SOCIAL, LLC
-
$4,005
$6,564
$9,415
$9,881
$6,330
604578320
IDAHO MILK PRODUCTS, INC.
-
-
$19,205
$18,853
$18,966
$12,427
604118379
INGREDIA INC
-
-
-
-
$198
$327
602726525
LAMB WESTON, INC.
$47,110
$26,378
$54,339
-
-
-
603351623
LAUREL'S CROWN, LLC
-
-
ND
$0
-
603462245
LITTLE ISLAND CREAMERY, LLC
-
-
ND
$0
$52
-
603114758
LOPEZ ISLAND CREAMERY LLC
-
ND
ND
$7
$403
$256
601015157
MISTERLY, RICHARD MICHAEL
-
-
-
-
$0
-
602292515
MONTEILLET FROMAGERIE, LLC
-
-
$47
$60
$84
$152
603159583
MORA LLC
-
$30
$2,705
-
-
-
602405011
MT. TOWNSEND CREAMERY CORPORATION
-
$3,350
$3,126
$3,964
$2,594
$250
604056888
NANAK FOODS INCORPORATED
-
-
-
$5,698
$54,643
$59,039
603480806
NORTH WHIDBEY FARM LLC
-
-
ND
$0
-
-
603257840
NUTRADRIED FOOD COMPANY, LLC
$10,174
$15,531
$28,485
$78,985
$113,853
$104,392
602947823
PORT TOWNSEND LOCAL MARKETPLACE, LLC
-
-
-
$0
$152
-
603008164
PRIDE & JOY CREAMERY, LLC
-
-
ND
-
-
-
604202432
ROSECREST FARM LLC
-
-
-
$1,828
$1,170
-
600643518
SAFEWAY INC.
$115,479
$197,354
$204,237
$182,283
$106,146
$203,820
600643518
SAFEWAY INC.
$194,595
$139,746
$141,777
$178,605
$149,489
$97,837
602513313
SIRENA GELATO, LLC
-
$2,118
-
-
-
-
603569617
SKAGIT MAID CREAMERY, LLC
-
ND
ND
$83
$27
-
173002203
SMITH BROTHERS FARMS, INC.
ND
$5,677
ND
$25,317
$7,865
$8,826
603051774
SNOOK, JOYCE MARIE
-
$1
$1
$54
-
-
601766387
SNOQUALMIE GOURMET ICE CREAM, INC.
$12,676
-
$8,957
$7,891
-
$6,910
604033670
THE COLOMBIAN TRADE COMPANY LLC
-
-
-
$0
-
-
603219468
TUNAWERTH LLC
-
-
-
-
$126
-
602653887
TWIN BROOK CREAMERY, LLC
ND
$368
ND
$407
$528
$989
603268987
TWIN SISTERS CREAMERY, LLC
-
ND
ND
$489
$1,662
$1,336
600514627
WELCH, EDWARD CALVIN
ND
-
-
-
-
-
604137933
WIIC LLC
-
-
ND
-
-
-
603132384
WIND MOUNTAIN CREAMERY LLC
$71
-
-
-
-
-
603304775
ZAUHAR'S ARTISAN CHEESE LLC
-
ND
ND
$21
$23
-
TOTAL
$4,380,661
$4,438,311
$4,908,738
$5,001,004
$5,641,425
$5,437,902
NOTE: "ND" means that a business filed a "0" credit amount or that it selected to
not disclose the amount of the credit taken (this option was available from 2006 -
2017 when the credit taken was less than $10,000).
Source: JLARC staff analysis of Department of Revenue Incentive and Reporting Public
Disclosure web page for dairy processor deductions, 2015-2020.
Preliminary Report: Food Processors
July 2022
Review Details
Appendix B: Fruit & vegetable beneficiaries
Fruit & vegetable product beneficiaries and their tax
savings: 2015-2020
This table reflects all businesses that used the fruit & vegetable processors
B&O tax deduction and filed an Annual Tax Performance Report in any year from 2015
through 2020. This detail is publicly disclosable per RCW 82.32.534(3). The yearly
totals may differ from the amounts listed for beneficiary savings totals in Section
3 because those totals may include businesses that did not file Annual Reports
with the Department of Revenue (DOR).
JLARC staff determined which of the beneficiaries are wineries by using one of two
methods:
Identifying the NAICS code (312130) for the winery industry in the Department of
Revenue's business information data.
Researching the business name and location to determine its main activity.
Exhibit B1: Fruit & vegetable beneficiaries, including wineries, 2015-2020
DOR Account No.
Business Activity
Business Name
2015 Preference Value
2016 Preference Value
2017 Preference Value
2018 Preference Value
2019 Preference Value
2020 Preference Value
603477516
W
A.R.T. LLC
-
$24
$231
$481
-
-
603366848
W
ABBOTT-HARRISON, L.L.C.
$55
-
-
-
-
-
602067973
W
ABEJA, LLC
$3,737
$3,459
$3,716
$4,052
$4,087
$6,274
603006295
FV
ACTIVE BERRY PACKERS, LLC
$5,597
$7,039
ND
$8,296
$8,449
$13,910
602539657
W
AIRPORT RANCH ESTATES, L.L.C.
$5,836
ND
ND
$7,251
$9,864
$9,250
603033102
W
ALLEROMB WINERY GROUP LLC
-
$2
$22
-
-
-
602885027
W
ALTA CELLARS LLC
$6
$22
$6
$9
$24
-
602188562
W
AMAVI, L.L.C.
$6,173
$2,674
$3,252
$3,963
$4,515
$3,987
601149817
W
AMERICAN WINE TRADE, INC.
$26,309
$21,517
$17,536
$16,995
$19,764
$14,741
603380378
W
ANCIENT LAKE WINE COMPANY, LLC
$1,553
ND
$16,509
$22,141
$18,786
$28,244
600441790
W
ANDERSON RESOURCES INCORPORATED
$10
$25
$26
$13
$33
$19
603485433
W
ANICHE CELLARS WASHINGTON, LLC
-
-
-
-
$210
$1,096
600138447
W
ARBOR CREST WINERIES AND NURSERY, INC.
$1,348
$844
$465
$1,018
$419
$171
603445585
W
ARCHEUS WINES, LLC.
-
-
ND
$38
$13
-
603262205
W
ARMSTRONG FAMILY WINERY LLC
ND
ND
ND
$95
$292
$376
602644794
W
ATLAS DRINKS, L.L.C.
-
-
$2,440
$2,589
$4,655
$7,659
602824721
W
AUCLAIR WINERY LLC
$67
$6
ND
$5
-
-
603606550
FV
BAD GRANNY CIDER CO., LLC
-
-
-
-
$2,482
-
601693978
W
BADGER MOUNTAIN, INC.
$17,519
$16,124
$27,457
$18,377
$20,576
$21,329
602052815
W
BAER WINERY LLC
$1,984
$1,066
$558
$1,315
$1,315
$839
603232695
W
BAINBRIDGE VINEYARDS, LLC
$15
-
-
-
-
-
604068480
W
BALBOA WINERY, LLC
-
-
-
$947
$1,666
$1,741
602656615
W
BARRAGE CELLARS, LLC
ND
ND
ND
$106
$448
$248
602879376
W
BARTHOLOMEW WINERY, INC.
ND
ND
ND
$35
$45
$71
604277438
FV
BAUMANN, RICHARD
-
-
-
$10
-
-
603416485
FV
BEAVER BEND FARM LLC
-
-
$0
$0
-
-
602265494
W
BERGHAN VINEYARDS MANAGEMENT, INC.
-
-
ND
$240
$389
$489
604287816
FV
BEYOND PICKLES LLC
-
-
-
-
$1
$2
602147628
FV
BJELLAND, LISA ELAINE
-
-
$0
-
-
-
603258665
FV
BLUE BUS FERMENTS, LLC
-
ND
ND
$623
$649
$673
603113807
FV
BLUE DRAGON FARMS LLC
-
-
-
-
$1,606
-
603381880
FV
BLUE SKIES FARM OF PUGET ISLAND, LLC
-
-
-
$10
-
-
603176548
FV
BOARDMAN FOODS INC
$2,550
ND
$3,537
$9,906
-
-
603402162
FV
BONA FIDE POTENTS LLC
-
-
ND
$10
-
$44
603247018
FV
BONACHE SAUCE, LLC
-
-
$0
$46
-
-
604289903
FV
BONNIE BS PEPPERS, LLC
-
-
-
$231
$8
-
603413649
W
BONTZU CELLARS LLC
-
-
$48
$46
$189
-
601847450
W
BOOKWALTER WINERY, L.L.C.
ND
ND
ND
$3,536
$5,497
$6,226
602409634
W
BRIAN CARTER CELLARS, LLC
$866
$840
ND
$624
$730
-
604094829
FV
BRUNSON MARTIN ENTERPRISES LLC
-
-
-
$234
$288
$568
602986570
W
BURNT BRIDGE CELLARS, LLC
$66
$116
$103
$110
$15
$29
602087832
W
BUTY WINERY, LLC
ND
$1,701
$1,742
$1,666
$2,674
$1,845
602224359
W
CAMARADERIE CELLARS, LLC
ND
ND
ND
$434
$363
$356
601177191
W
CAMARDA CORP., INC.
ND
$5,670
ND
$5,010
$3,572
$5,953
602727108
W
CASTILLO DE FELICIANA VINEYARD AND WINERY, LLC
$0
ND
ND
$2,677
-
-
602134644
W
CAVE B LLC
$206
ND
ND
$212
$221
$372
604292618
FV
CCL UNLIMITED LLC
-
-
-
$0
-
-
603233659
FV
CELLAR CIDERS LLC
-
-
-
$0
-
-
601858545
W
CHANDLER REACH VINEYARDS, L.L.C.
$5,321
$22
$1,139
$1,140
$763
$670
603172548
FV
CHANG, XIA
-
-
ND
$19
-
-
601788719
W
CHARLES REININGER, L.L.C.
$2,555
$1,746
$2,435
$5,497
$3,489
$2,978
602761118
W
CHARLES SMITH WINES LLC
$115,439
$119,259
604157444
W
CHATEAU BECK, LLC
-
-
-
$21
$87
$8
602109947
W
CHATEAU FAIRE LE PONT LLC
ND
$3,816
ND
$4,145
$5,091
$4,539
602499736
W
CHATEAU ROLLAT WINERY, LLC
$1
$2
$2
$1
-
-
602223615
W
CHELAN RIDGE LLC
-
-
ND
$0
-
-
602194319
W
CHELAN WINE COMPANY L.L.C.
$37
$608
$52
$35
$4
$15
600594678
W
CHINOOK WINES
$5
$6
$8
-
-
-
603362207
FV
CHRISTIAN, SETH
ND
-
-
-
-
-
600647795
FV
CHUKAR CHERRY COMPANY
$1,129
$1,210
$1,556
-
-
-
604111434
FV
CHUNN, CHELSEA RHEA
-
-
ND
$5
-
-
603216800
FV
CIDER ARCHITECTS, LLC
-
-
-
$0
$42
$57
604005193
FV
CIDERAUCTION, LLC
-
-
-
-
$52
$64
603210160
W
CIELO, LLC
-
-
ND
$476
$477
$609
601701240
W
CLAAR CELLARS, L.L.C.
$2,705
$4,031
$2,654
$2,701
$2,056
$1,245
602523778
W
COL SOLARE, LLP
-
-
$17,142
$18,083
$11,442
$8,789
602395265
FV
COLUMBIA FRUIT HOLDING ENTERPRISES, LLC
$175,773
$310,248
$311,662
$76,614
-
-
604204303
FV
COLUMBIA FRUIT PROCESSING, LLC
-
-
-
$371,006
$344,350
$510,653
602802639
W
COLUMBIA HILLS WINERY, LLC
-
-
-
$1,153
$1,201
$693
601758099
FV
COLUMBIA MANUFACTURING INC.
$12,680
$7,281
$2,906
-
-
-
603052859
W
COLUMBIA VALLEY FAMILY FARMS, INC.
-
-
$45,291
$16,847
$16,044
$20,763
602358718
W
CONFLUENCE CELLARS, L.L.C.
-
-
-
-
$73
$73
602118590
W
CONSTELLATION BRANDS, INC.
$127,311
$133,076
$241,207
$235,225
$205,092
-
602909690
W
CONVERGENCE ZONE CELLARS, LLC
ND
$3
$7
$14
$68
$118
602139603
W
COOPER WINE COMPANY, LLC
$572
-
-
-
-
$1,530
604202282
FV
COOTS, JAMES EDWARD
-
-
-
$0
$7
602933688
W
CORLISS ESTATE L.L.C.
-
-
$6,502
$6,687
$1,640
$1,962
602523728
W
CORVUS CELLARS LLC
-
-
ND
-
-
-
602102392
W
COUGAR HILLS, LLC
$2,577
$2,234
$1,888
$1,485
$1,287
$80
601082376
W
COVENTRY VALE WINERY, INC.
$76,623
$110,211
$18,141
$135,403
$16,759
$15,300
602523116
W
COYOTE CANYON WINERY LLC
-
$20
$42
$68
$244
$357
603287784
FV
CRF FROZEN FOODS, LLC
$345,834
$151,892
-
-
-
-
602112503
FV
CRUNCH PAK, LLC
$543,141
$571,583
$524,553
$546,169
$563,793
$525,129
603175064
FV
CUIZINA FOOD COMPANY, LLC
$117,212
$37,822
-
-
-
-
603238139
W
DAMSEL CELLARS, LLC
-
ND
ND
$50
$73
$109
602812816
W
DARBY WINERY, INC.
ND
ND
ND
$767
$442
$614
603214301
W
DDDK LLC
ND
ND
ND
$825
$1,031
$1,317
603262772
W
DELILLE CELLARS, LLC
$4,327
$7,085
$12,977
$13,430
$14,143
$12,508
603138239
W
DELMAS, LLC
ND
ND
ND
$312
$563
$897
601826429
W
DELVO, JONATHAN PAUL
-
ND
-
-
-
-
602430248
W
DES VOIGNE WINERY LLC
$15
$3
$78
$10
$14
$10
603524004
W
DEVONA, LLC
$776
ND
$63
$258
$244
$552
602170365
W
DINEEN FAMILY VINEYARDS, L.L.C.
ND
-
ND
$0
$29
$54
602445782
W
DOUBLE CANYON VINEYARDS, LLC
-
-
-
$17,514
$20,814
$10,107
603584939
W
DOUBLE CANYON WINERY LLC
-
ND
$13,819
$437
-
-
603221720
W
DOUBLE D WINERY LLC
-
-
$73
$533
$110
$1,370
602930459
W
DOUBLEBACK, LLC
-
-
$11,221
$12,525
$14,739
$4,762
603445225
W
DRINK WASHINGTON STATE, LLC
-
ND
$15
$48
-
$125
601931471
FV
DRR FRUIT PRODUCTS COMPANY, INC.
$24,740
$37,444
$36,436
$36,010
$38,454
$36,680
602266640
W
DUMAS STATION WINES, L.L.C.
-
-
-
-
-
$1,385
601898746
W
DUNHAM CELLARS, L.L.C.
$4,261
$6,993
ND
$7,705
$12,867
$9,087
600163093
W
E. & J. GALLO WINERY
$78,392
$53,176
$57,329
$40,642
$74,679
$29
604298735
FV
EARLY BIRD BERRIES LLC
-
-
-
$0
-
-
603040117
W
EIDOLON WINERY, INC.
ND
-
-
-
-
-
602663720
W
ELEGANTE' CELLARS, L.L.C.
-
-
$17
$99
-
$27
603133954
W
ELEVEN WINERY, INC.
-
$118
$183
$231
$488
$690
601843571
FV
EMPIRE FRUIT, INC.
ND
ND
ND
$4,417
$2,491
-
603521013
W
EPONA, L.L.C.
-
-
$0
$1
-
-
602302491
W
FALL LINE WINERY, LLC
$239
$63
$60
$2
$1
$1
600615548
FV
FANTASIA, DENELLE SUZANNE
-
-
$0
$0
-
-
604445928
FV
FARMERS INVESTMENT CO.
-
-
-
-
$433
$180
602726550
W
FIGGINS ESTATE LLC
$3,905
$4,904
$4,141
$4,210
$4,278
$4,692
602829686
W
FINN HILL WINERY, LLC
-
-
$4
$0
$0
-
601920774
W
FIRE HOUSE, L.L.C.
$7,831
$5,631
$6,260
$2,923
-
-
604060719
FV
FIREFLOWER SAUCE, LLC
-
-
-
$0
$1
-
601536695
FV
FIRESTONE PACIFIC FOODS, LLC
$126,013
$148,719
$171,110
$254,966
$251,240
$278,921
602849088
W
FLETCHER BAY WINERY, LLC
-
$155
-
$86
$126
$175
602822700
W
FLYING DREAMS, LLC
$37
$21
$14
$1
-
-
603275990
FV
FOGGY RIDGE LLC
-
ND
$63
-
-
-
604040242
FV
FOOD SERVICE SLICING, LLC
-
-
$37,842
$70,499
$86,171
-
602120884
W
FORGERON CELLARS, LLC
$813
$1,152
$550
$989
$900
$1,192
602318161
W
FOUNDRY VINEYARDS LLC
$1,028
ND
$247
$240
$81
$299
603300017
W
FOX IN A BOX WINES, LLC
ND
ND
$73
$83
$64
$119
601888041
FV
FRESH FOODS OF WASHINGTON, LLC
$545,785
$569,183
$570,964
$535,631
-
-
601166938
W
FRIES, CAMERON SCOTT
$0
-
-
-
-
-
600451260
FV
FRUITSMART, INC.
$197,827
$255,379
$287,936
$361,316
$227,060
-
600492614
W
G. WOLF ENTERPRISES, INC.
$5,605
$5,844
$4,439
$3,027
-
-
602310190
W
GAMACHE VINTNERS, LLC
$2,796
$2,832
ND
$442
$219
$323
601042431
FV
GARDEN FRESH FOODS, INC.
$7,872
$11,265
$13,186
$13,728
$10,966
$10,311
602923077
W
GECKO WINE COMPANY LLC
-
$5
-
-
-
-
602827645
W
GIANT WINE COMPANY, LLC
ND
ND
ND
$301
$259
-
602507566
W
GILBERT CELLARS, LLC
ND
ND
ND
$955
$692
$471
602925224
W
GINO CUNEO CELLARS LLC
$258
$283
$148
$214
$91
$260
600574245
W
GORDON BROTHERS CELLARS INC.
-
$12,313
ND
$1,384
$1,690
$1,951
602143549
FV
GORGE DELIGHTS, INC.
$1,448
602738830
W
GRAND REVE VINTNERS, LLC
-
-
ND
$581
$653
-
602314517
W
GRAPE VISIONS LLC
$6,316
$5,680
$5,235
$7,023
$5,061
$6,115
603132162
W
GRAPES & GRAIN, L.L.C.
$77
$85
ND
$182
$129
$184
604315255
FV
GREENLEAF FOODS, SPC
-
-
-
$124,227
$264,961
$235,813
602464663
W
GREG & PAM HARRINGTON WINES LLC
ND
ND
ND
$8,984
$5,802
$6,660
603196093
FV
GRIMMWAY ENTERPRISES, INC.
-
-
-
-
$19,436
-
604223811
W
GROSGRAIN VINEYARDS LLC
-
-
-
-
$36
$251
602554674
W
GUARDIAN CELLARS, LLC
ND
ND
ND
$1,196
$1,082
$1,427
603422517
W
HANATORO WINERY, LIMITED LIABILITY COMPANY
$102
603201570
W
HARMELL CELLARS, LLC
$6,248
$7,974
$13,951
$14,765
-
-
602536543
W
HENCE CELLARS, L.L.C.
-
-
$0
$0
-
-
603530992
W
HENRY EARL ESTATES, LLC
ND
$170
$67
$250
$79
$19
603442287
FV
HIGH J ORCHARDS, LLC
-
-
$240
$449
$40
-
602707727
W
HIGHTOWER CELLARS LLC
$165
$132
ND
$262
$194
$361
603221997
W
HOHIMER FAMILY WINES LLC
-
-
ND
-
-
-
600367461
W
HOODSPORT WINERY, INC.
$1,015
$923
$1,046
$997
$822
$824
601473873
W
HORN, RACHAEL A
-
-
-
$1,824
$944
-
602881807
W
H T SJOLUND LLC
ND
$90
ND
-
-
-
603091521
W
HUBBARD, KIRK WESLEY
-
-
-
$84
-
-
603340484
W
HURRICANE HILLS, LLC
-
-
-
$0
-
-
601959691
W
HYATT FARM PARTNERSHIP, L.P.
ND
ND
ND
$2,992
$1,770
$1,573
603008961
W
ICON CELLARS LLC
-
-
$6
-
-
604028975
FV
ILA'S FOOD, LLC
-
-
-
$0
-
-
601842886
FV
INGREDION INCORPORATED
-
$46,224
$77,811
$124,432
-
-
604463527
FV
INNOVATIVE FREEZE DRIED FOOD, LLC
-
-
-
-
$2,871
-
602736130
FV
INVENTURE - WA, INC.
$434,816
$371,897
-
-
-
-
601876709
W
ISENHOWER CELLARS, LLC
$1,050
$814
$991
$1,115
$1,094
$1,549
602226221
W
J B GEORGE, LLC
$665
-
-
-
-
-
134001535
FV
J. R. SIMPLOT COMPANY
$1,533,279
$1,708,958
$1,947,960
$1,980,214
$2,086,081
$1,983,573
603153552
W
J&J VINTNERS LLC.
-
$18
602820158
W
J & S CRUSHING, LLC
-
ND
-
$6,686
-
-
603283733
W
JESTER CELLARS, LLC
-
-
-
$41
$123
$199
602928145
FV
JEWEL APPLE, LLC
$118,589
$116,304
$143,014
$193,519
$156,473
$141,486
602229670
W
J-NH WINE GROUP, LLC
$4,225
ND
ND
$3,589
$16,593
$5,691
602668292
W
JOE FOREST WINES LLC
-
ND
ND
$72
$116
$203
602467310
FV
JOHNSON BERRY FARM, LLC
-
-
$0
$0
-
-
397010545
FV
JOHNSON FOODS, INC.
$118,062
$100,901
$87,887
$119,842
$13,486
$93,946
602139095
W
K VINTNERS, L.L.C.
$20,840
$38,536
$88,233
$106,165
$117,492
$135,815
603585869
W
K&R WINES, LLC
-
-
-
-
$95
$314
602356326
W
KARMA VENTURES, LLC
$82
603176047
FV
KANSHA NATURAL FOODS LLC
-
$423
$758
$174
$46
-
603460279
W
KASIA WINERY, LLC
-
ND
ND
$0
-
-
600627711
FV
KENNEDY ENDEAVORS, LLC
$60,679
$104,568
$173,191
$120,395
$150,454
$83,226
601993681
W
KESTREL PROPERTIES, LLC
$2,235
$4,700
$1,147
$360
$145
$299
603074628
W
KEVIN WHITE WINES LLC
$84
$132
$248
$201
$195
$292
604267579
W
KIKASS DONNI & THINGS LLC
-
-
-
-
-
$50
602389902
W
KING ESTATE WINERY LIMITED PARTNERSHIP
ND
-
-
-
-
-
603095616
W
KIONA VINEYARDS, LLC
$4,369
ND
ND
$4,879
$4,559
$4,596
602864125
W
KITZKE CELLARS LLC
$18
ND
-
-
-
$1,249
602330916
W
KOLIBRI ENTERPRISES LLC
-
-
-
$4
$3
$3
602800566
W
KONTOS WINE GROUP LIMITED LIABILITY COMPANY
-
$523
-
-
-
-
602582709
FV
KOSKI, KARI LYNN
ND
-
-
$0
-
-
604298424
FV
KULPIT, MICHAEL WILLIAM
-
-
-
$1
-
-
601223078
FV
KYLE MATHISON ORCHARDS, INC.
$77
$52
$45
$206
$202
$65
602069293
W
LAKE CHELAN TRADING COMPANY, LLC
-
-
$704
$704
$760
$393
602862166
FV
LAMB WESTON BSW, LLC
$354,976
$453,203
$481,626
$595,313
-
-
602726525
FV
LAMB WESTON, INC.
$2,341,907
$2,516,034
$3,266,474
$3,830,029
$4,712,519
-
601835477
FV
LAO, YANG L
-
ND
$34
$25
-
-
601550471
FV
LARSON, EYHILD CHRISTIN
-
-
$0
$0
$0
-
600471954
W
LATAH CREEK WINE CELLARS, LTD.
$202
$210
$193
$176
$131
$140
603487701
W
LATTA WINES, LLC
$153
$2,371
ND
$1,877
$497
$993
602803069
FV
LATTINS COUNTRY CIDER MILL & FARM, INC.
$659
$725
$616
$674
$554
$534
602567547
W
LAURELHURST CELLARS, LLC
$0
ND
ND
$5
$1
-
603286341
FV
LAWLOR, AUDRA QUERY
-
$242
$18
-
-
-
602429420
W
LAWRELIN WINE COMPANY
-
$8
$8
$117
$10
$11
602611617
W
LAWRENCE CELLARS, LLC
ND
ND
ND
$414
$237
$499
602169159
FV
LAZY J TREE FARM, INC.
-
-
ND
-
-
-
601866881
W
LEAF CELLARS, L.L.C.
ND
ND
ND
$1,243
$1,233
$1,188
602082269
W
LEONETTI CELLAR, LLC
$15,239
$15,199
$15,020
$15,505
$15,733
$15,590
603592735
FV
LESEDI FARM LLC
-
-
ND
$56
-
-
601937916
W
LIGHTNING RIDGE INVESTMENTS, LLC
$211
$176
$132
$129
$102
$86
603371573
FV
LICHTENFELS, MARIE-CLAIRE
ND
-
$0
-
-
-
602422560
W
LIVIN RIGHT WINES LLC
$23
$28
$38
$12
$23
$43
602555331
W
LODMELL CELLARS, LLC
$2
ND
$21
$68
$36
$14
602237984
W
LONG SHADOWS VINTNERS LLC
$16,989
$18,115
$17,392
$6,170
$15,095
$17,797
603381739
W
LOVE THAT RED, LLC
-
-
ND
$11
$18
-
600255034
W
LOWDEN SCHOOLHOUSE CORPORATION
ND
ND
ND
$5,897
$6,470
-
600544786
FV
LUND, ANGEL K
-
-
-
-
$0
-
603391014
W
M & L PRODUCTION, LLC
ND
-
-
$0
-
-
603335759
W
M & Z VINTNERS, LLC
-
-
-
-
-
$10
602369649
W
M. E. M. LLC
$819
$896
$1,188
$1,045
$41
$1,050
602941959
W
MACKEY VINEYARDS LLC
$20
$14
$1
$5
$5
-
602488948
W
MAD CAR WINE COMPANY, LLC
ND
$853
$693
$613
$477
$428
602737463
W
MADSEN FAMILY CELLARS, LLC
-
-
ND
$0
$3
-
602360436
W
MANNINA CELLARS, LLC
-
$33
$0
-
-
-
602998212
W
MANSION CREEK CELLARS LLC
-
-
-
-
$104
602292786
W
MARK RYAN WINERY, LLC
ND
ND
ND
$4,457
$2,689
$8,031
602859270
W
MARKET VINEYARDS LLC
-
-
$171
$163
$1,364
$257
601979642
W
MARSHAL'S WINERY, INC.
ND
ND
ND
$79
-
-
602551067
W
MARTINEZ VINEYARD L.L.C.
$2
$2
ND
$48
-
-
602624040
W
MATRICK HOLDINGS, CORPORATION
ND
ND
ND
$2,833
$2,815
$2,209
601540932
FV
MAYAN SUN, INC.
ND
ND
-
-
-
-
601359694
W
MCCREA CELLARS, INC.
ND
ND
ND
$84
$32
$68
602619275
W
MERCER WINE ESTATES, LLC
$20,020
$20,785
$14,236
$1,100
-
-
601911298
FV
METHOW VALLEY CIDERHOUSE INC.
-
-
-
$1
-
-
603160190
FV
MIDORI FARM LLC
-
-
$7
$806
-
-
602238543
W
MILLIE JONES IRREVOCABLE INTERVIVOS TRUST FOR THE FAMILY OF*
-
ND
$981
$8,100
-
-
602915783
FV
MILNE ASEPTICS LLC
$16,054
-
-
-
-
600171170
FV
MILNE FRUIT PRODUCTS, INC.
$275,557
$367,157
$370,255
$384,720
$366,477
$354,614
603321664
W
MONTICULE GROUP, LLC
-
-
-
$0
-
-
602092303
W
MORCHELLA WINE CELLARS, LLC
ND
ND
ND
$1,818
$2,833
$2,922
603139170
FV
MOSES LAKE PROCESSING LLC
$4,876
$4,211
$2,880
$20,059
$21,970
-
602908005
W
MOSQUITO FLEET WINERY LLC
$63
ND
ND
$10
$113
$57
178000544
FV
NATIONAL FROZEN FOODS CORPORATION
$797,434
$878,622
$784,994
$908,497
$841,567
$1,117,451
603309473
W
NEIGEL VINTNERS LLC
-
-
-
$333
$208
$103
601928853
W
NEW FOOTHILLS PROPERTIES L.L.C.
$11
$47
603603375
FV
NEWGEM FOODS, LLC
-
-
ND
$3,204
$3,615
$3,936
604056134
FV
NOBO MICROFARMS, LLC
-
-
-
$105
$73
$26
602686084
FV
NORTHWEST BERRY CO-OP
$50,686
$14,716
$12,839
$14,902
$29,431
$48,261
602379205
W
NORTHWEST CELLARS, LLC
$491
$328
$455
$379
$276
$711
602981795
FV
NORTHWEST FROZEN, LLC
$23,509
-
-
$71,909
$85,198
$51,050
604050892
FV
NORTHWEST SNACKS, INC.
-
-
$2
-
-
-
603441391
W
NOVIELLO VINEYARDS, L.L.C.
$12
$8
ND
$19
-
$12
602305962
FV
NPCP QUINCY, LLC
$142,730
$92,274
$102,948
$80,733
$64,744
-
601835720
W
O. S. WINERY LLC
ND
ND
ND
$38
$4
-
602847224
W
OBELISCO ESTATES, LLC
ND
ND
ND
$498
$548
$654
141004575
FV
OCEAN SPRAY CRANBERRIES, INC.
$250,978
$252,903
$262,627
$131,899
$118,198
$118,472
603180360
FV
OLAM WEST COAST INC
-
-
-
$5,556
$289
$320
602470974
W
OLDFIELD CELLARS, LLC
$1,668
$2,563
$1,879
$1,571
$1,439
$1,008
604369280
FV
OLYKRAUT SPC
-
-
-
-
$1,067
$1,487
604073373
W
OPAL WEST WINES, LLC
-
-
-
-
-
$2,708
603386655
FV
ORASELLA FOODS, LLC
-
-
-
$205
$10
$63
602070392
FV
OREGON POTATO COMPANY
$463,564
$281,213
$486,933
$599,134
$677,088
$906,749
604215690
W
ORENDA WINERY, LLC
-
-
-
-
-
$8
603471511
FV
PABLITO'S SALSA COMPANY LLC
-
-
ND
-
-
-
602655028
W
PACIFIC RIM WINEMAKERS, INC.
$33,707
$44,653
$41,876
$50,936
$37,401
$29,742
603039642
W
PACIFIC WINE ENTERPRISES, LLC
ND
ND
ND
$2
-
-
602336410
W
PAGE CELLARS LLC
$145
-
$469
$722
$472
-
603006816
W
PANDORA CELLARS LLC
$12
ND
-
-
-
-
602701974
W
PAPINEAU LLC
ND
$957
$1,488
$2,700
$9,360
$8,288
602814603
FV
PASCO PROCESSING, LLC
$561,870
$501,454
$499,902
$416,880
$225,802
$555,651
602271021
W
PASEK CELLARS WINERY, INC.
$280
-
$1,158
$1,354
$1,093
$954
604404892
FV
PENSIEVE FOODS LLC
-
-
-
-
$0
-
601904720
W
PEPPER BRIDGE WINERY, L.L.C.
$3,727
$3,311
$3,987
$4,197
$4,269
$3,925
604095663
FV
PIE LOVE LLC
-
-
ND
$0
-
-
603414888
W
PLAIN CELLARS, LLC
ND
ND
ND
$14
$6
$10
602504551
W
PONDERA WINERY L.L.C.
-
-
ND
$132
-
-
604155224
FV
PORTER GREENE INC.
-
-
-
$0
-
-
602207746
W
PRECEPT BRANDS LLC
-
-
$559,680
$173,503
$254,545
$325,827
601137315
FV
PREMIER PACKING COMPANY
ND
ND
ND
$290
$944
-
603426046
W
PROJECT LOGAN, LLC
-
ND
$134
$59
$814
$2,852
603083812
W
PROLETARIAT WINE COMPANY, LLC
$1,863
ND
ND
$1,852
$2,396
$1,333
604030766
W
PURSUED BY BEAR, LLC
-
-
$405
$2,190
$2,220
$3,254
600294241
W
QUILCEDA CREEK VINTNERS, INC.
$39,116
$34,783
$41,683
$47,829
$37,989
$55,678
603436789
FV
RAINMAKER CIDER LLC
ND
$388
-
-
-
-
602750435
W
RASA VINEYARDS, LLC
$915
$2,084
$1,466
$4,253
$2,950
$3,791
604014724
W
RECKONING LLC
-
-
-
$38
$16
-
604286079
W
RED BAND CELLARS, LLC
-
-
-
$2,264
-
$8,042
602542517
W
RED MOUNTAIN VITICULTURE, LLC
ND
ND
ND
$326
$223
$216
409022068
FV
RESER'S FINE FOODS, INC.
$443,405
$448,534
$457,897
$523,100
$591,692
$403,934
602606494
W
REVELRY VINTNERS, LLC
$5,181
$6,511
ND
$5,468
$5,752
$4,767
602470939
W
REYNVAAN FAMILY VINEYARDS, LLC
-
-
-
$0
$0
-
603066733
W
REZABEK VINEYARDS, LLC
-
ND
-
$3
$5
-
602283783
W
RIVERAERIE CELLARS, L.L.C.
$192
$155
$3,457
$194
$146
$196
602897317
W
ROBERTS FAMILY ENTERPRISES, INC.
ND
-
-
-
-
-
602663644
W
ROBISON RANCH CELLARS, LLC
$15
-
-
-
-
-
602555957
W
ROCKWALL CELLARS LLC
$97
-
-
-
-
-
604632843
FV
ROOT 24 FARMS, INC
-
-
-
-
-
$9,950
604037215
FV
ROOT CELLAR FARM LLC
-
-
-
$0
-
-
602073831
FV
ROYAL RIDGE FRUIT & COLD STORAGE, LLC
-
-
$173,116
$190,964
$199,359
$223,093
604329260
W
ROYAL SLOPE VINTNERS LLC
-
-
-
-
-
$240
602102170
W
RRJ REAL PROPERTIES, LLC
-
-
-
$164
$514
$682
601866508
W
RUSSELL CREEK, L.L.C.
ND
-
$3
$6
-
-
603338820
W
RYAN HERSHEY ENTERPRISES, INC.
$15,951
$20,200
$20,831
$14,317
$22,521
$17,609
601216044
FV
SAKUMA BROTHERS PROCESSING, INC.
$85,973
$102,347
$99,010
$92,239
$69,473
$93,914
604012551
W
SALAMIDA CELLARS LLC
-
-
-
-
-
$4
602868710
W
SAN JUAN VINEYARDS
$132
-
-
-
-
-
604176906
W
SAN JUAN VINEYARD L.L.C.
-
-
-
$961
$33
$70
600480881
FV
SANTOS, CLARITA P
-
-
ND
-
-
-
603182574
W
SAVAGE GRACE WINES LLC
ND
ND
ND
$344
$499
$292
602095845
W
SAVIAH ROSE WINERY LLC
$3,853
$4,676
ND
$5,435
$5,453
$6,239
603265251
FV
SCABLAND JUICE, LLC
$33
$33
ND
-
-
-
602419037
W
SCHAFER WINERY, LLC
ND
ND
$1,082
$767
$1,473
$846
603538978
W
SECRET SQUIRREL WINE L.L.C.
-
-
$2,732
$3,752
$1,479
$1,675
602297281
FV
SEGO'S HERB FARM LLC
ND
$893
ND
$745
-
-
603104449
FV
SEIBERT, MARY E
-
-
-
$10
-
-
600309447
FV
SENECA FOODS CORPORATION
-
-
-
$109,611
$12,973
$13,499
602252467
FV
SENECA SNACK COMPANY
$70,522
$75,564
$59,734
$57,080
$61,158
-
601162933
FV
SHONAN (U.S.A.), INC.
$39,163
$39,542
$39,266
$53,097
$63,289
$46,097
603519974
W
SIGHTGLASS CELLARS LLC
-
-
-
$22
$109
$77
603055346
W
SIGILLO CELLARS, LLC
-
$21
$38
$34
-
$133
602747589
W
SILVER OWL, LLC
$44
$140
$111
$101
$61
$85
603507442
W
SIMPATICO CELLARS, LLC
-
-
ND
$40
$47
$69
604203643
FV
SIMPLOT FROZEN VEGETABLES, LLC
-
-
-
$128,881
$314,431
$313,696
602975823
W
SINCLAIR ESTATE VINEYARDS, LLC
-
$134
-
$177
$90
-
603150289
W
SIREN SONG WINES LLC
-
-
$39
$40
$123
$134
602529857
W
SKYLITE CELLARS LLC
-
$387
$110
$83
-
-
602304618
W
SLEEPING GIANT WINERY, LLC
$1,599
$2,057
$2,159
$2,061
$1,575
$2,253
602696027
W
SLEIGHT OF HAND CELLARS, LLC
$1,455
$5,277
ND
$4,618
$4,886
$5,040
603146332
FV
SLICKFORK RANCH LLC
-
-
-
$0
-
-
604215083
W
SMAK LLC
-
-
-
-
$183
$260
247000013
FV
SMITH & NELSON, INC.
$21,606
-
-
-
-
-
602211649
FV
SMUCKER FRUIT PROCESSING COMPANY
$99,949
$108,677
$210,274
$279,848
$259,692
$182,516
602451205
FV
SNO-CO BERRY PAK, LLC
$19,863
$18,066
$12,944
$15,766
$13,550
$17,848
399003097
FV
SNOW & SONS PRODUCE CO.
$27,491
-
$38,275
$43,998
$36,624
$20,761
602991322
W
SOL STONE, LLC
-
-
-
$3
$27
$45
602466474
W
SOOS CREEK WINE CELLARS, LLC
$516
$874
$976
$1,052
$548
$514
604105522
FV
SORBATTO LLC
-
-
$10
-
-
$239
602503446
W
SPARKMAN CELLARS LLC
ND
ND
ND
$2,569
$2,817
$2,206
602869094
FV
SPRINGBOARD KRAUT LLC
$109
$116
-
-
-
-
603160724
FV
SPRINGRAIN FARM AND ORCHARD, INC.
-
-
-
$0
-
-
600099424
W
STE. MICHELLE WINE ESTATES LTD.
$2,782,192
$2,936,037
$2,011,307
$1,857,347
$1,918,911
$1,846,913
602277940
W
STEPHENSON CELLARS LLC
-
-
ND
-
-
-
602516216
W
STEPPE CELLARS LLC
-
ND
ND
-
-
-
602250130
W
STEVENS WINERY LLC
ND
ND
ND
$310
$231
$271
603342208
W
STEWART FAMILY WINES, LLC
-
-
-
-
$23
$29
603379729
W
STORY CELLARS, LLC
$42
604222489
FV
STYSKAL, MICHAEL
-
-
-
-
-
$5
601099075
FV
SUNFRESH FOODS, INC.
-
$11,935
$12,138
$12,592
$13,237
$4,332
603067601
FV
SUN-RYPE CONCENTRATES, INC.
$46,975
$32,255
$32,953
$44,305
$35,343
$50,525
603054535
FV
SUN-RYPE PRODUCTS (USA), INC.
$78,875
$85,148
$79,480
$68,460
$82,814
$47,766
602038242
FV
SVZ USA WASHINGTON, INC.
$181,059
$173,799
$164,715
$178,240
$181,889
$200,310
603582941
W
SWANBERG, YVONNE R
-
ND
ND
-
-
-
602636943
W
SWEET VALLEY WINES L.L.C.
ND
ND
ND
$9
-
-
602949207
W
TASARA, LLC
ND
ND
ND
$34
$31
-
602502079
FV
TATOES, LLC
-
-
$2,906
-
-
-
603422354
FV
TAYLOR FARMS NORTHWEST, LLC
-
-
-
$37,767
$69,928
$98,420
602205228
W
TENOR WINES, LLC
ND
ND
ND
$1,210
$1,360
$3,498
601466895
W
TERRA BLANCA VINTNERS, INC.
$12,851
$14,096
$15,102
$16,306
$16,158
$4,275
602859728
W
TERRA VINUM, LLC
$460
$418
ND
$253
$671
-
602509317
W
TERTULIA CELLARS LLC
ND
ND
-
-
-
-
602493267
W
THE ANGELS' SHARE, LLC
ND
ND
ND
$866
$522
$616
601752752
FV
THE FIELD ROAST GRAIN MEAT COMPANY SPC
$47,952
-
$258,356
$305,086
-
-
604100290
FV
THE GIRL MEETS DIRT COMPANY
-
-
ND
$734
$1,682
$2,560
600539083
FV
THE NEIL JONES FOOD COMPANY
$318,671
$204,723
$204,606
$184,554
$243,006
$244,571
604607816
FV
THE SOURCE CIDER LLC
-
-
-
-
-
$39
602855212
W
THIRD LEAF, LLC
$114
603314428
FV
THREE OF CUPS, LLC
$198
$19
$13
$492
$930
$32
602839264
FV
TIETON CIDER WORKS, LLC
-
-
-
-
-
$6,798
603236088
W
TRANCHE ESTATE L.L.C.
-
-
$3,374
$5,307
$761
$707
603473053
FV
TREASURE VALLEY TURF INC.
-
-
$0
-
-
-
392000956
FV
TREE TOP, INC.
$1,037,487
$957,754
$1,025,834
$963,560
$820,130
$975,004
602602024
W
TRIO WINE CO. LLC
ND
-
-
-
-
-
601016191
FV
TRIPLE "B" CORPORATION
-
ND
ND
$4,649
$5,655
$4,516
602867849
FV
TROUT LAKE ABBEY LLC
-
-
-
$0
$2
-
602597675
W
TUURI WINES, LLC
-
$58
ND
$120
$104
$164
600585886
FV
TWIN CITY FOODS, INC.
$665,721
$712,915
$703,136
$770,016
$422,972
$492,055
602842144
FV
UNCOMMONLY GOOD LLC
-
$0
-
-
-
-
603405824
W
UNDERGROUND WINE PROJECT, LLC
ND
ND
ND
$1,728
$4,704
$2,372
603169364
W
UPCHURCH VINEYARD L.L.C.
ND
ND
ND
$734
$1,163
-
603227968
W
UPROOTED WINES, LLC
-
$12
$24
$114
$14
$22
601981617
W
V&C, LLC
$9,038
$8,433
$36,096
$42,729
$8,079
$12,526
603415131
W
V SQUARED VINEYARDS LLC
-
$333
$288
$850
-
-
604086099
W
VALDEMAR ESTATES USA, INC.
-
-
-
-
-
$454
600379627
FV
VALLEY PROCESSING, INC.
$0
-
-
-
-
-
603036880
FV
VASHON CIDERWORKS, LLC
$174
$242
$256
$145
$256
$163
604134445
FV
VEGANIC CHOICE MICROFARMS, LLC
-
-
-
$295
-
-
602416648
W
VILLA DI MELLISONI VINEYARDS, LLC
-
-
-
$0
$60
$70
602210703
W
VINE & SUN, L.L.C.
$1,844
-
$254
$86
$328
$1,188
603511933
W
VINTAGE WINE ESTATES, INC.
-
-
-
-
-
$4,236
604049082
W
VITAL WINES
-
-
-
-
-
$209
602949113
W
VORTEX CELLARS, LLC
$9
$2
-
-
-
-
602575231
W
VOTRE VIGNERON LLC
$179
$244
$353
$351
$196
$528
602504853
W
WAHLUKE WINE COMPANY, INC.
$17,297
$25,773
$27,005
$36,827
$25,361
$24,100
602203272
W
WALISER WINERY, L.L.C.
-
-
-
$90
-
-
603073492
W
WAPATO POINT CELLARS, LLC
-
-
-
-
-
$127
602466157
W
WARD JOHNSON WINERY, LLC
-
-
-
$13
$14
-
603295784
W
WARR-KING WINES LLC
ND
$11
ND
$2
$6
-
602127411
W
WASHINGTON VINTNERS L.L.C.
$4,650
$4,692
$6,522
$919
$46
$22
602005402
W
WASHINGTON WINE COMPANY LLC
$290
$341
$373
$455
$532
$1,088
602088438
W
WAVING TREE, LTD.
-
-
$79
-
$112
$148
603040276
W
WBWCO LLC
ND
ND
ND
$1,668
$1,491
$2,247
600105869
FV
WELCH FOODS INC., A COOPERATIVE
$83,492
$84,168
$73,715
$152,830
-
$248,370
603515257
FV
WELSH, PEGGY J
-
ND
ND
$77
-
-
602568936
W
WHIDBEY ISLAND VINEYARD & WINERY LTD.
-
$107
$163
$136
$105
$145
603112617
W
WHITE SPACE COMPANIES, LLC
$323
$547
$300
$42
-
-
602930469
W
WILLOW CREST WINE ESTATES, LLC
-
-
$99
$4,032
-
-
602968204
FV
WILSON BANNER RANCH, L.L.C.
$148
-
ND
$167
$68
-
603162670
W
WINCHESTER WINERY LLC
-
$0
-
-
-
-
603206041
FV
WIND RIVER BIOMASS UTILITY LLC
-
-
-
-
-
$497
602307606
FV
WM. BOLTHOUSE FARMS, INC.
$138,976
$168,652
$144,651
$39,592
$136,371
$767
603432486
FV
WOODINVILLE CIDERWORKS, LLC
-
-
$0
-
-
-
601017882
W
WOODWARD CANYON WINERY, INC.
-
$5,369
$4,941
$4,574
$4,255
$4,805
602006636
W
WWSB, LLC
ND
-
-
-
-
-
601116052
FV
WYCKOFF FARMS, INCORPORATED
$74,558
$96,627
$81,438
$102,338
$56,487
$98,675
602365157
W
WYLIE-YOUNG L.L.C.
-
ND
ND
$4,205
$4,568
$4,327
604127985
FV
YOUNKER, JUSTIN
-
-
ND
-
-
-
602160682
W
Z - WINES, LLC
-
ND
ND
$107
$73
$156
603318161
W
ZIMMEL UNRUH CELLARS, LLC
-
$1
-
-
-
-
Total
$16,690,987
$17,017,355
$18,016,066
$19,546,429
$18,192,122
$13,726,401
NOTE: Winery (W) or Fruit & Vegetable Processors (FV). "ND" means that a
business filed a "0" credit amount or that it selected to not disclose the amount of
the credit taken (this option was available from 2006 - 2017 when the credit taken
was less than $10,000).
Source: JLARC staff analysis of Department of Revenue Incentive and Reporting Public
Disclosure web page for fruit & vegetable processor deductions, 2015-2020.
Preliminary Report: Food Processors
July 2022
Review Details
Appendix C: Seafood beneficiaries
Seafood product beneficiaries and their savings, 2015 - 2020
This table reflects all businesses that used the seafood product processing B&O tax
deduction and filed an Annual Tax Performance Report in any year from 2015 through 2020.
This detail is publicly disclosable per RCW 82.32.534(3). The yearly totals may differ
from the amounts listed for beneficiary savings in section 4 because those totals may
include businesses that did not file Annual Reports with the Department of Revenue.
Exhibit C1: Seafood beneficiaries, 2015-2020
DOR Account No.
Business Name
2015 Preference Value
2016 Preference Value
2017 Preference Value
2018 Preference Value
2019 Preference Value
2020 Preference Value
602544878
ALLEN SHELLFISH LLC
-
-
$829
$1,125
$874
$782
601596024
AWERS, INC.
$14,253
$13,627
$16,597
$18,850
$17,542
$23,727
602018765
BARLEAN'S FISHERY INC.
ND
-
ND
$284
-
-
601959543
BELL BUOY CRAB CO., INC.
$34,194
$46,262
$27,121
-
-
-
602410318
BENTHIC FISHING, LLC
ND
ND
$21,892
$17,061
$13,946
$6,301
602213008
BLOSSOM ENTERPRISES, L.L.C.
$5
$0
-
-
-
-
371003179
BORNSTEIN SEAFOODS, INC.
$54,844
$67,517
$66,950
$104,622
$74,743
$58,116
601672453
BRATTON & OLHEISER
-
-
$1,881
$2,092
$1,765
$1,451
603324294
CHETLO HARBOR SHELLFISH LLC
-
-
$3,288
$3,306
$1,566
$4,012
603025517
COASTAL VILLAGES POLLOCK LLC
-
ND
$203,989
$244,792
$238,334
$294,219
602825648
COOKE AQUACULTURE PACIFIC, LLC
$11,130
$24,735
$159,424
$190,977
$143,082
-
601547809
DANA F. BESECKER COMPANY, INC.
-
$279,838
$284,395
$196,359
$175,379
$206,987
602118869
EELY, INC.
-
$351
$888
$309
-
-
600442821
EKONE OYSTER COMPANY
$23,212
$25,376
ND
-
-
-
603365089
ELKHORN OYSTER LLC
$944
ND
$577
$908
$1,160
$1,974
602878152
FAT-CAT FISH, LLC
$17,154
$13,425
$23,385
$29,352
$31,057
$37,906
602398756
FISHING VESSEL SEAFOODS, LLC
-
$0
-
$0
-
-
600329138
FRANCO FISH PRODUCTS, INC.
$11,733
$19,506
$26,738
$17,680
$8,326
$6,314
603424390
GOLDBELT SEAFOODS, LLC
$16,175
-
-
-
-
-
239000847
HAMA HAMA COMPANY
$4,371
$5,978
$12,507
$11,500
$6,436
$22
601886060
HIGH ROCK FISH CAMP, INC.
$8
-
-
-
-
-
600159809
JESSIE'S ILWACO FISH COMPANY, INC.
$7,148
-
$46,992
$29,309
$18,618
$6,313
601292651
LOKI FISH COMPANY
$1,808
$1,354
$663
$747
-
-
603002877
LUSAMERICA FOODS, INC.
$36,936
$15,640
$119,718
$213,830
$153,805
$149,707
602845777
MARINE HARVEST USA LLC
$7,340
$9,598
$5,090
$2,581
-
-
602310378
MBR GEODUCK L.L.C.
ND
ND
ND
$356
$224
$264
603216558
MINTERBROOK OYSTER CO.
$8,685
-
-
$11,522
-
-
342010181
NATIONAL FISH AND OYSTER CO., INC.
$10,454
-
-
-
-
-
601951991
NET VENTURE FARMS, INC.
-
-
$0
$2,408
-
$1,235
600088328
NORTHERN FISH PRODUCTS, INCORPORATED
-
$21,903
$43,519
$38,686
$29,972
$23,019
602354657
NORTHSTAR SEA FOODS, INC.
ND
$10,542
$2,194
$2,581
$12,265
-
600260087
NORTHWEST CASTER & EQUIPMENT, INC.
$5
$17
$6
-
-
-
604588894
OBS SMOKED & DISTRIBUTION, LLC
-
-
-
-
-
$120,192
602732618
OCEAN BEAUTY SEAFOODS LLC
-
$82,020
$87,969
$187,650
$184,681
$83,337
601568741
OCEAN GOLD SEAFOODS, INC
-
-
$122,273
$141,745
$142,262
$102,753
600427977
ODYSSEY ENTERPRISES, INC.
$171,117
$179,077
$53,649
$185,388
-
-
604104818
ORCA BAY FOODS, LLC
-
-
-
$0
$241,538
$216,353
600594540
ORCA BAY SEAFOODS, INC.
$726,418
$816,613
$821,590
-
-
-
602564955
PALIX OYSTER, INC.
$403
$405
$649
$793
-
-
602163563
PALOMINO FOODS, L.L.C.
ND
$8,293
$28,052
$12,232
-
$4,602
600358246
RAU, GLEN W
ND
ND
ND
$697
$164
-
602010547
RUBIN SALES INC.
-
$7,260
-
-
-
-
603120238
SEA FALCON LLC
-
-
-
-
-
-
600544166
SEABEAR COMPANY
$16,839
$5,474
$6,221
$5,808
$5,132
$10,281
603005358
SEAFOODS PROCESSING CONTRACTORS INC.
$19,902
-
-
-
-
-
601612434
SHELFORD'S BOAT, LTD.
$6,419
$3,966
$36,891
$47,131
$30,835
$550
603424158
SILVER BAY SEAFOODS, LLC
-
-
$299,519
$291,554
$574,231
$383,493
602810789
SOUTH BEND PRODUCTS LLC
$33,656
$33,334
$23,224
$71,915
$68,191
$92,731
603371446
SOUTH SOUND MARICULTURE LIMITED LIABILITY COMPANY
-
ND
ND
$1
$297
$0
602868104
SPARKS, CHRISTOPHER PETER
$3,394
-
-
-
-
-
602245630
SPORTSMEN'S CANNERY, INC.
-
-
ND
$100
$110
$156
602839679
TRANS OCEAN SEAFOODS, INC.
$17,718
$13,580
$10,689
$13,338
$15,098
$9,823
601005522
TRIDENT SEAFOODS CORPORATION
$1,351,521
$1,091,426
$1,198,704
$1,048,915
$810,722
$880,231
603554200
U.S. MARINE RANCH GROUP CO
-
-
ND
$797
$13
-
602014308
WALLIN'S OYSTERS AND CLAMS LLC
$5,484
$5,271
ND
-
-
-
602003278
WESTERN UNITED FISH COMPANY INC.
$167,957
$201,408
$182,869
$171,092
$133,485
$110,159
603510558
WESTPORT CUSTOM SEAFOOD, LLC
-
-
-
-
-
$170
602146022
WESTPORT SEAFOOD, INC.
$5,073
$6,371
$6,387
$8,271
$9,072
$11,380
259001167
WIEGARDT BROS., INC.
$30,777
-
-
$19,020
$23,636
$23,772
604197199
WILD GRILL FOODS LLC
-
-
$3,984
$5,771
$6,984
Total
$2,817,075
$3,010,167
$3,947,328
$3,351,671
$3,174,332
$2,879,315
NOTE: "ND" means that a business filed a "0" credit amount or that it selected to
not disclose the amount of the credit taken (this option was available from 2006 -
2017 when the credit taken was less than $10,000).
Source: JLARC staff analysis of Department of Revenue (DOR) Incentive and Reporting
Public Disclosure web page for seafood product processor deductions, 2015-2020.
Preliminary Report: Food Processors
July 2022
Review Details
Appendix D: REMI overview
What is REMI?
JLARC staff used Regional Economic Models, Inc.'s (REMI) single-region, 160 industry
sector Tax-PI software (version 2.5) to model the economic impacts of the B&O tax
deductions and preferential rates for dairy product, fruit & vegetable, and
seafood product processors and certain sellers.
Multiple state governments, private sector consulting firms, and research
universities also use REMI's dynamic economic modeling to evaluate policy impacts.
Model is tailored to Washington and includes a government sector
Tax-PI is an economic impact tool used to evaluate the fiscal and economic effects
and the demographic impacts of a tax policy change. The software includes various
features that make it particularly useful for analyzing the economic and fiscal
impacts of tax preferences:
REMI staff consulted with staff from the Office of Financial Management (OFM) and
customized a statewide model to reflect Washington's economy.
The model contains 70 industry sectors, based on the North American Industry
Classification system (NAICS) codes.
In contrast to other modeling software, Tax-PI includes state and local government
as a sector. This permits users to see the trade-offs associated with tax policy
changes (e.g., effects on Washington's economy from both increased expenditures by
businesses due to a tax preference, along with decreased spending by government due
to the associated revenue loss).
For current revenue and expenditure data, users can input information to reflect
their state's economic and fiscal situation. This allows JLARC staff to calibrate a
state budget using up-to-date information from the Economic and Revenue Forecast
Council (ERFC) and the Legislative Evaluation and Accountability Program
(LEAP).
The model can forecast economic and revenue impacts multiple years into the
future.
Model simulates the full impact of a tax policy change
The REMI model accounts for the direct, indirect, and induced effects as they spread
through the state's economy, which allows users to simulate the full impact of a tax
policy change over time.
Direct effects are industry specific and capture how a target industry responds to
particular policy change (e.g., changes in industry employment following a change in
tax policy).
Indirect effects capture employment and spending decisions by businesses in the
targeted industry's supply chain that provide goods and services.
Induced effects capture the in-state spending and consumption habits of employees
in targeted and related industries.
The REMI model produces year-by-year estimates of the total statewide effects of a
tax policy change. Impacts are measured as the difference between a baseline economic
and revenue forecast and the estimated economic and revenue effects after the policy
change.
Model includes economic, demographic, and fiscal variables
The REMI model is a macroeconomic impact model that incorporates aspects of four
major economic modeling approaches: input-output; general equilibrium; econometric;
and new economic geography. The foundation of the model, the inter-industry matrices
found in the input-output models, captures Washington's industry structure and the
transactions between industries. Layered on top of this structure is a complex set of
mathematical equations used to estimate how private industry, consumers, and state and
local governments respond to a policy change over time.
The supply side of the model includes many economic variables representing labor
supply, consumer prices, and capital and energy costs.
Regional competitiveness is modeled via imports, exports, and output.
Demographics are modeled using population dynamics (births, deaths, and economic
and retirement migration) and include cohorts for age, sex, race, and
retirement.
Demographic information informs the model's estimates for economic consumption and
labor supply.
The dynamic aspect comes from the ability to adjust variables over time as
forecasted economic conditions change.
While the model is complex and forecasting involves some degree of uncertainty,
Tax-PI provides a tool for practitioners to simulate how tax policy and the resulting
industry changes affect Washington's economy, population, and fiscal situation.
Preliminary Report: Food Processors
July 2022
Review Details
Appendix E: REMI Analysis
REMI analysis shows the range of potential employment impacts if
the Legislature removes the three food processor preferences
JLARC staff used Regional Economic Models, Inc.'s (REMI) single-region, 160 industry
sector Tax-PI software (version 2.5) tool to model scenarios that illustrate potential
employment effects if the tax preferences (B&O exemptions and future preferential
B&O rates) for dairy product, fruit & vegetable, and seafood product
manufacturers are removed.
JLARC staff did not model a scenario to address removal of the preferences for
wineries because that industry is not available in the 160 industry sector Tax-PI
software tool.
This technical appendix provides context and supporting information for the analysis
summarized in Section 6 of the report.
REMI methodology
User inputs in REMI
REMI’s Tax-PI model allows users to estimate the impacts of policy changes to
Washington’s economic activity and government finances (see Appendix D for an overview
of the REMI model).
Before modeling policy scenarios, JLARC staff set parameters by calibrating the model
to the state budget. JLARC staff used the November 2021 revenue estimates produced by
the Economic and Revenue Forecast Council (ERFC) and budgeted expenditures from the
2021 budget, as reported by the Legislative Evaluation and Accountability Program
(LEAP) Committee. This provides the budget and revenue data for the model and serves
as the starting point for Tax-PI’s economic and fiscal forecasts.
Users also specify whether government expenditures are determined by demand or
revenue.
"By demand" imposes a level of government spending in future years that is
necessary to maintain the same level of service as the final year in which budget
data is entered.
"By revenue" ties government expenditures to estimated changes in revenue
collections.
JLARC staff modeled the scenarios with expenditures determined by demand. This avoids
assumptions about how policymakers may alter spending priorities in the future. In
addition, current budget allocations are carried forward for each expenditure
category.
In order to best isolate the effects of a hypothetical removal of the tax
preferences, JLARC staff modeled the scenarios with the balanced budget restriction
option turned off. If the balanced budget restriction were turned on, it would force
revenue and expenditures to be equivalent, and doing so may impose some limitations on
economic activity and obscure the effects of a policy change.
Data for the REMI model
The REMI model includes historical economic and demographic data from 2001 onward.
The data comes from federal government agencies, such as the U.S. Census Bureau, U.S.
Energy Information Administration, the Bureau of Labor Statistics, and the Bureau of
Economic Analysis. As described above, current revenue and expenditure data for
Washington comes from ERFC and LEAP. The inputs for the three modeled scenarios
described below are based on JLARC staff estimates of future dairy product, fruit
& vegetable, and seafood product manufacturing levels and beneficiary savings.
JLARC staff based the growth rate for each industry classification on the beneficiary
savings estimate through 2025, and on the growth rate of REMI’s baseline projection
for each respective industry’s output for subsequent years.
Beneficiary industries in REMI
The scenarios described below estimate the economic activity and tax revenue impact
using North American Industry Classification System (NAICS) codes:
3114 - Fruit & vegetable preserving and specialty food manufacturing.
3115 - Dairy product manufacturing.
3117 - Seafood product preparation and packaging.
The scenarios capture the inter-industry purchases by the three food manufacturing
industries. The results below focus on the estimated employment impacts of the three
industries, based on the stated public policy objectives for the preferences.
Modeled scenarios estimate the employment impact if the tax preferences were
removed
To illustrate the industries’ potential response and the associated employment
effects, JLARC staff simulated a removal of the tax preferences. The scenarios assume
the economic burden of the removal is experienced by the three food manufacturing
industries through an increase in production costs.
The discussion in section 6 of the report expresses these changes as adding, rather
than removing, the preferences.
Model forecasts future impacts
The REMI model is a forecasting tool. It estimates change in economic activity and
government revenues based on underlying model data and the budget parameters described
above.
JLARC staff modeled the effects of removing the tax preferences beginning in 2020,
the first forecast year in the model. This provides estimates of employment beginning
in fiscal year 2020 through fiscal year 2031.
Removing the tax preferences increases production costs
To model this scenario, JLARC staff assumed removal of the preferences increases each
industry’s production costs. The approach used the following parameters:
Loss of beneficiary savings begins the first day of fiscal year 2020, when the tax
preferences are removed.
Model inputs are estimated by increasing production costs by each industry’s tax
savings. Through fiscal year 2025, these values are the staff estimate of
beneficiary savings. In subsequent years, the savings are grown at the same rate as
the baseline level of each industry’s output in the REMI model.
State and local governments will spend the increased revenue from the removal of
the tax preferences.
The estimates for the increases in production costs (and corresponding equivalent
increases in government spending) for each respective industry are shown below ($ in
millions).
Exhibit E1: Production costs are expected to increase in all three industries when
tax preferences are removed
Industry
2020
2021
2022
2023
2024
2025
2026
2027
2028
2029
2030
2031
Production costs for Fruit & vegetable preserving & specialty food
manufacturing – (3114)
$13.9 M
$14.1 M
$14.4 M
$14.7 M
$15.0 M
$15.3 M
$11.0 M
$11.1 M
$11.1 M
$11.2 M
$11.3 M
$11.4 M
Production costs for Dairy product manufacturing - (3115)
$5.5 M
$5.7 M
$6.1 M
$6.4 M
$6.9 M
$7.3 M
$5.3 M
$5.4 M
$5.4 M
$5.5 M
$5.6 M
$5.7 M
Production costs for Seafood product preparation and packaging - (3117)
$2.9 M
$3.0 M
$3.0 M
$3.1 M
$3.2 M
$3.3 M
$2.4 M
$2.5 M
$2.5 M
$2.5 M
$2.6 M
$2.6 M
Source: JLARC staff analysis of confidential Department of Revenue tax return
data.
The removal of the preferences in this scenario results in a net increase of 121
jobs, averaged over fiscal year 2020 to fiscal year 2031. The individual industry
changes that comprise this total include:
Average of 59 jobs lost in the fruit & vegetable preserving & specialty
food manufacturing industry.
Average of 8 jobs lost in the dairy product manufacturing industry.
Average of 13 jobs lost in the seafood product preparation and packaging industry.
Average of 8 jobs lost in other manufacturing industries.
Average of 184 state and local government jobs and 25 other private nonfarm jobs
gained statewide. This employment increase is driven by the assumption that
increased tax revenues would be spent in the public sector.
Exhibit E2: Jobs are expected to increase in state and local government and private
nonfarm industries if tax preferences are removed
Industry
2020
2021
2022
2023
2024
2025
2026
2027
2028
2029
2030
2031
All Industries
145.6
135.4
138.7
141.4
144.7
149.1
95.2
99.2
100.0
101.7
101.5
101.4
Fruit & vegetable preserving & specialty food manufacturing
(3114)
-72.6
-72.3
-71.4
-70.7
-70.1
-69.4
-49.5
-48.1
-46.8
-45.7
-44.6
-43.6
Dairy product manufacturing (3115)
-8.6
-8.9
-9.2
-9.5
-9.9
-10.2
-7.5
-7.3
-7.2
-7.1
-7.0
-6.9
Seafood product preparation & packaging (3117)
-17.9
-17.4
-16.8
-16.2
-15.8
-15.3
-10.6
-10.1
-9.7
-9.3
-8.9
-8.5
Other manufacturing
-8.2
-8.9
-9.0
-9.1
-9.1
-9.0
-6.9
-6.5
-6.2
-5.9
-5.7
-5.6
Other private nonfarm
39.2
27.3
28.9
29.4
30.4
31.7
14.1
18.2
19.1
20.6
20.5
20.5
State and local government
213.7
215.6
216.3
217.6
219.1
221.4
155.5
153.1
150.8
149.1
147.2
145.5
Source: JLARC staff REMI analysis.
Preliminary Report: Food Processors
July 2022
Review Details
Appendix F: Ernst & Young analysis
JLARC contracted with Ernst & Young to estimate the impact of
state tax preferences on effective tax rates in Washington and neighboring states
Ernst & Young (EY) analyzed the state and local tax climate for three food
manufacturing industries in Washington and four neighboring competitor states. EY
compared estimates of the tax burdens for small and large hypothetical firms investing
in alternative locations for Washington-based food processors or because of their
significant presence in the industry (i.e., Alaska for seafood industry):
California
Idaho
Oregon
Alaska (seafood only)
The industries included in the analysis and their North American Industry
Classification System (NAICS) codes are:
3114 - Fruit & vegetable preserving and specialty food manufacturing
3115 - Dairy product manufacturing
3117 - Seafood product preparation and packaging
Wineries are not included in the analysis for fruit & vegetable manufacturers.
Wineries are classified under a separate NAICS code (312130).
Consultant analysis modeled additional scenarios for each preference
The consultants modeled two scenarios each for fruit & vegetable and seafood
product processors:
Scenario 1: The tax preferences are applied as in current law. The B&O
exemption is in effect through June 30, 2025, and then replaced by the preferential
0.138% B&O rate until 2052 (30 years in the future).
Scenario 2: The current B&O exemption is extended through 2052.
For the dairy product processing analysis, the consultants modeled three scenarios:
Scenario 1: The tax preferences are applied as in current law. The B&O
exemption is in effect through June 30, 2025, and then replaced by the preferential
0.138% rate until January 1, 2036, after which the general 0.484% manufacturing
B&O rate applies through 2052.
Scenario 2: The B&O exemption is extended through 2052.
Scenario 3: The B&O exemption is replaced July 1, 2025, by the 0.138
preferential B&O rate, which is extended through 2052.
The results detailed below are based on scenario 1, since that scenario approximates
the impact of current law. The other scenarios would reduce the effective tax rate in
Washington further than current law does. The results for other scenarios are
available in the Ernst & Young report available here.
Details of the analysis
To perform the analysis, EY used a discounted cash flow model programmed with the
financial features of each industry and the relevant tax features and rates in each
state.
The financial profiles estimate metrics such as employment, wages, business assets,
income, and expenses based on public data and EY calculations. The size of the
representative small and large firms varies by industry, based on the distribution of
firm sizes in each industry in Washington and the competitor states.
Exhibit F1: EY calculated small and large representative firms for each industry
classification
Industry
Small firm employment
Large firm employment
Fruit & vegetable preserving and specialty food manufacturing
45
250
Dairy product manufacturing
20
235
Seafood product preparation and packaging
15
165
Source: JLARC staff analysis of EY report.
EY analyzed the tax systems in each of the competitor states and coded them into its
model. The model estimates the tax burdens resulting from corporate income tax, sales
tax on business inputs, property tax, franchise tax, and gross receipts taxes such as
the Washington B&O tax. The burden of these taxes was combined to estimate the
effective tax rate (ETR), expressed as the percentage change in the hypothetical
business's rate of return due to taxes.
Next, EY analyzed the availability of statutory and negotiated tax incentives and
evaluated their impact on each business's ETR in each state. The analysis included the
following categories of statutory tax incentives, available to all businesses that
meet statutory eligibility requirements:
Tax credits due to job creation.
Tax credits due to investment.
Wage rebates.
Preferential tax rates.
Tax credits due to research and experimentation (R&E) expenditures.
Sales and use tax exemptions on capital investments.
The analysis also included a review of discretionary or negotiated incentives that
may be available to the representative businesses. This portion of the review relies
on the experience and knowledge of EY professionals and the typical incentive size for
similar projects. Because of their discretionary nature, there is no formal source for
the level of benefits and the impact of such potentially available incentives would
not be verifiable public information.
The results are presented as a comparison of the states' effective tax rates for a
small and a large representative business before any tax incentives and after
statutory and negotiated incentives. The states' pre-incentive and post-incentives
ETRs are reported in the exhibits below for a small and the large firm in each of the
three industries.
Exhibit F2: Incentives reduce dairy industry ETR, but WA rate is highest before and
after incentives
Source: JLARC staff analysis of EY report.
Exhibit F3: Incentives reduce fruit & vegetable industry ETR, but WA rate is
highest before and after incentives
Source: JLARC staff analysis of EY report.
Exhibit F4: Incentives reduce seafood industry ETR, but WA rate is highest before and
after incentives
Source: JLARC staff analysis of EY report.
Full Ernst & Young report available
Click here for the full EY report, which provides additional detail about the
methodology, data sources, and results of the analysis.
Preliminary Report: Food Processors
July 2022
Recommendations & Responses
Legislative Auditor's Recommendations
Legislative Auditor's Recommendations:
B&O preferences for dairy processors: Continue and clarify
The Legislature should continue the B&O tax preferences for dairy product
processors because they are meeting the objectives of providing tax relief and
creating and retaining industry jobs. To facilitate future reviews, the Legislature
should clarify its expectations for job and wage growth and determine the level of tax
relief needed to meet those expectations.
Legislation Required: Yes
Fiscal Impact: Depends on legislative action.
B&O preference for dairy products used as an ingredient or component to create
other dairy products: Allow to expire
The Legislature should allow the preference for dairy products used as an
ingredient or component to create other dairy products to expire as scheduled,
June 30, 2023. The infant formula production in Sunnyside that the preference was
intended for in 2013 did not occur.
Legislation Required: No
Fiscal Impact: None
B&O preferences for fruit & vegetable processors: Continue and clarify
The Legislature should continue the B&O tax preferences for fruit &
vegetable processors because they are meeting the objectives of providing tax relief
and creating and retaining industry jobs. To facilitate future reviews, the
Legislature should clarify its expectations for job and wage growth and determine the
level of tax relief needed to meet those expectations.
Legislation Required: Yes
Fiscal Impact: Depends on legislative action.
B&O tax preferences for seafood processors: Review and clarify
The Legislature should review the B&O tax preferences for seafood product
processors because they are only meeting one of two objectives. While the preferences
provide tax relief, beneficiary jobs in Washington have declined and their employee
wages have decreased. It is unclear why more businesses are not using the preference
or what the Legislature's expectations are for the industry's jobs and wages.