Legislative Auditor’s Conclusion:

The preferences make Washington’s commercial transportation industry more competitive. They support more freight traffic at ports and higher employment in transportation and freight-dependent industries.


November 2023

Executive Summary

Four preferences reduce the amount of Public Utility Tax (PUT) paid by commercial transportation providers

Estimated Biennial Beneficiary Savings

$219.8 million

(2027-29 biennium)

Tax Type

Public Utility Tax

RCW 82.16.050(6, 8-10)

Applicable Statutes

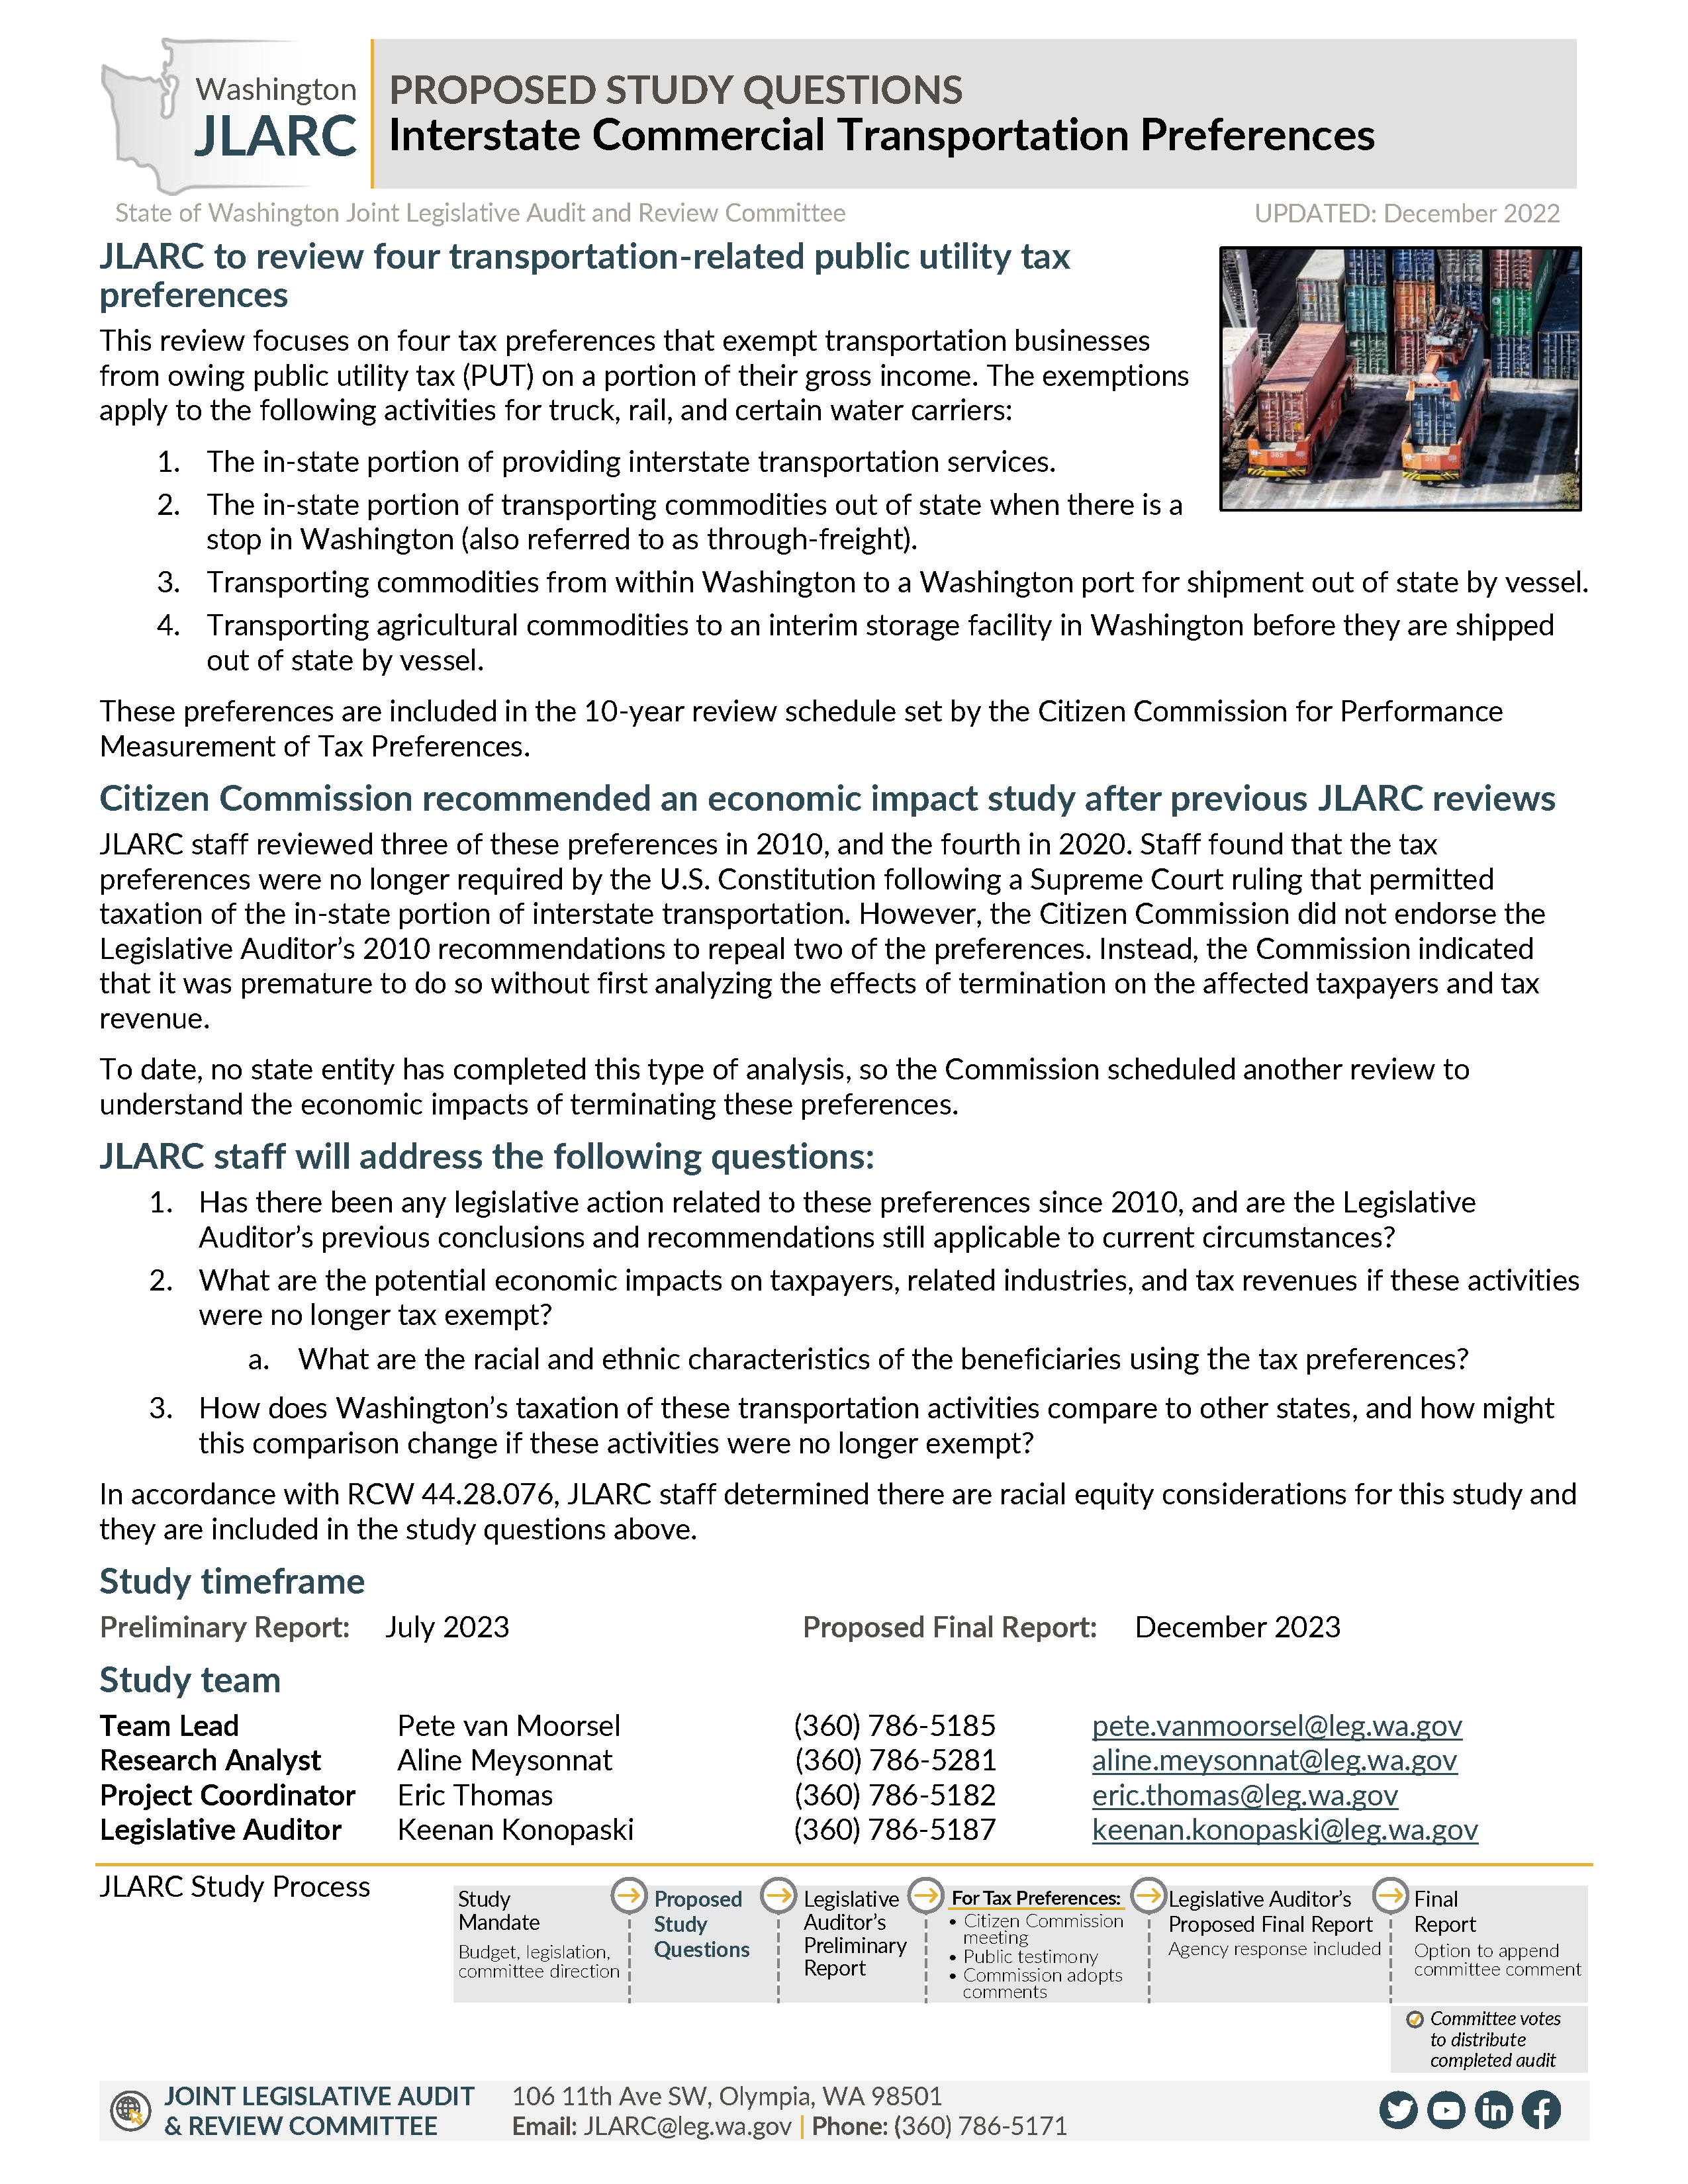
Commercial transportation that takes place entirely within Washington is generally subject to public utility tax (PUT). The four tax preferences in this review exempt earnings from transportation that occurs inside Washington if the transported goods will move across state or international lines. Specifically, the exemptions apply to earnings from:

  1. The in-state portion of interstate transportation.
  2. Interstate shipments of goods that stop in Washington for storage, manufacturing, or processing before they are transported to a final destination (through-freight).
  3. Transporting Washington commodities directly to a Washington port for export by vessel. 
  4. Transporting Washington agricultural products to an interim storage facility before shipment to a Washington port for export by vessel. 

The preferences do not have an expiration date.

Citizen Commission requested economic analysis

The first three preferences were enacted in the 1930s. JLARC staff inferred the objective was to comply with the Commerce Clause of the U.S. Constitution. Based on subsequent Supreme Court decisions, JLARC's 2010 review of the preferences determined that they were no longer needed for constitutional compliance.

The Legislative Auditor recommended repealing two of the preferences. The Citizen Commission for the Performance Measurement of Tax Preferences (Commission) did not endorse this recommendation, noting that affected taxpayers had structured their business activities on the assumption that the preferences would exist and that termination could have unintended negative consequences. The Commission called for an economic impact study of repeal.

The preferences make Washington’s commercial transportation industry more competitive

This report provides three analyses that illustrate different ways the preferences improve the competitiveness of Washington's transportation industry.

Preferences keep Washington taxes on interstate rail and truck transportation lower than average

The first analysis compares the estimated tax burdens for interstate rail and truck transportation in Washington and 10 other states. With the preferences, Washington has the lowest taxes for interstate rail transportation and the fourth lowest for interstate truck transportation (Section 4).

Bar graphs comparing state and local tax costs for Washington and ten other states for rail and truck transportation.  The PUT exemptions reduce Washington taxes to below the average of the ten other states.
Source: Ernst & Young analysis.

Preferences reduce the cost of transporting freight through Washington, supporting increased freight volume at ports

The second analysis estimates the preferences' effect on the level of activity at ports. Stakeholders were concerned that repealing the preferences could increase the cost of transporting import and export freight through Washington. This could lead some businesses to divert shipments away from Washington ports to competitors in other states and Canada.

A consultant with expertise in supply chains and economic analysis of freight transportation estimated the trade diversion to other ports would be 0.16% of containerized imports, 0.5% of containerized exports, and 2.7% of grain exports (Section 4).

Preferences reduce transportation costs, supporting additional employment for the Washington transportation industry and its customers

If the Legislature repealed the preferences, transportation businesses would pay more public utility tax and general fund revenue would increase. JLARC staff used an economic model to estimate the economic impacts of these changes in two ways: 1) increased production costs for affected industries and 2) increased government spending. In general, the analysis suggests that the increased production costs lead to a loss of jobs, while increased government spending leads to an increase in jobs.

Transportation businesses might pass the increased costs to their customers. Two scenarios illustrate that the change in jobs and the affected industries depend on how much they pass on.

  • In Scenario A, transportation businesses pass none of the increase to customers. There is a net loss of 785 private sector jobs, primarily in transportation, construction, manufacturing, and retail.
  • In Scenario B, transportation businesses pass all of the increase to customers. There is a net loss of 860 private sector jobs, primarily in manufacturing, farming, transportation, retail, and forestry, fishing, and hunting (Section 5).
Scenario A: Transportation businesses pass none (0%) of the tax cost to customers Scenario B: Transportation businesses pass all (100%) of the tax cost to customers
Sector Job losses Job gains Net change Job losses Job gains Net change
Private -1,730 945 -785 -1,805 945 -860
Public -180 925 745 -165 925 760
Total -1,910 1,870 -40 -1,970 1,870 -100
Source: JLARC staff analysis.

Recommendations

Legislative Auditor's Recommendation: Clarify

The Legislature should clarify the objectives for these preferences. They are no longer necessary to comply with the Constitution because the U.S. Supreme Court has changed its interpretation of the Commerce Clause. The Legislature may have other objectives for the preferences, though it has not stated them in law.

  • If the Legislature has other objectives for these preferences, it should state those objectives and, if applicable, establish measurable criteria. Objectives for similar preferences include: to create and retain jobs, attract and retain businesses, and make Washington competitive with other states.
  • If the Legislature's sole objective for the preferences is to avoid taxing any activity whose taxation is constitutionally prohibited, it should repeal the preferences because a fairly apportioned PUT would be constitutionally permitted. Such a policy change would require a method of apportioning transportation income to activities within the state.

You can find more information in Recommendations.

Commissioners' Recommendation

Endorse Legislative Auditor recommendation to clarify but the preference should be continued. The Legislature should retain these preferences but clarify the purpose and metrics to aid future reviews. All of the preferences benefit both large and small transportation companies that often operate with relatively low profit margins while still providing family wage jobs. The preferences for transporting Washington commodities directly to a Washington port for export by vessel and transporting Washington agricultural products to an interim storage facility before shipment to a Washington port for export by vessel support the use and viability of the state’s ports. Since Washington’s ports are a key part of the economy, and there is intense competition for port services on the West Coast, the elimination of these preferences could adversely impact port activity.

Committee Action to Distribute Report

On November 29, 2023 this report was approved for distribution by the Joint Legislative Audit and Review Committee.

Action to distribute this report does not imply the Committee agrees or disagrees with the Legislative Auditor recommendations.

23-05 Final Report: Interstate Transportation

November 2023

REVIEW Details

1. Preferences reduce tax cost for four transportation industries

With the preferences, commercial transportation providers pay less public utility tax

Businesses that transport goods in Washington pay public utility tax

Businesses that engage in transportation, communications, and the supply of energy, natural gas, and water pay public utility tax (PUT) on their gross earnings. PUT is paid in lieu of the business and occupation tax. The PUT rate depends on the specific activity. For transportation businesses, the rate ranges from 0.642% (e.g., urban transportation) to 1.926% (e.g., railroads, trucking).

Four PUT preferences exempt gross earnings from the Washington portion of interstate or international transportation

Generally, transportation that takes place entirely within Washington is subject to PUT. However, the four preferences in this review exempt earnings from transportation that occurs inside Washington if the transported goods are moving across state or international lines (Exhibit 1.1). Businesses in four transportation industries — truck, rail, water, and pipeline — can benefit from the tax preferences. Income from the out-of-state portion is not subject to Washington taxation.

Exhibit 1.1: Four preferences exempt gross earnings from the portion of interstate or international transportation that occurs in Washington

Yellow lines on the maps indicate the portion exempt from PUT.

Preference Preference Details
In-state portion of interstate transportation services

RCW 82.16.050(6)

Map showing freight movement between Washington and an out of state location. The in-state portion is highlighted because the preference exempts earnings from this segment from tax.

Exempts: Gross earnings from the in-state portion of interstate transportation.

Example: A business ships goods between Washington and another state.

Through freight

RCW 82.16.050(8)

Map showing freight movement between Washington and an out of state location with a stop inside Washington. The in-state portion is highlighted because the preference exempts earnings from this segment from tax.

Exempts: Gross earnings from the entire in-state portion of an interstate freight haul. A shipment may stop in Washington for storage, manufacturing, or processing before it is sent to its final destination.

Requirement:

  1. Shipment must be billed under a through-freight rate. This means one business ensures the goods are delivered to the final destination, even if other carriers are involved.

Example: A business ships goods to a storage or processing facility in Washington. The company later transports the goods to an out-of-state location. 

Shipments to port

RCW 82.16.050(9)

Map showing freight movement from a location in Washginton to an in-state port. This movement is highlighted as it is exempt from tax.

Exempts: Gross earnings from moving freight from a location in Washington directly to an instate port, dock, wharf, export elevator, or ship.

Requirements:

  1. The origin and point of delivery must be in different cities or towns.
  2. Shipment must next be transported by vessel to a location outside the state.

Example: A business moves grain by tug and barge from a location in Washington to an export terminal in a Washington port. An export vessel ships it to a foreign destination.

Shipping farm products to port

RCW 82.16.050(10)

Map showing transport of agricultural products from a point in Washington to an interim storage facility. The preference exempts this transportation from tax.

Exempts: Gross earnings from moving agricultural products from a location in Washington to an interim storage facility (e.g., grain warehouse) before they are shipped to port.

Requirements:

  1. Shipment is stored before it is moved to an export elevator, wharf, dock, or ship for shipment out of state by vessel.
  2. The same business must operate the interim storage facility and the storage facility at the port.

Example: A business transports grain from a Washington farm to a grain elevator on the Snake River. The grain is next moved by tug and barge to an export terminal in a Washington port. From there, it is shipped by vessel to a foreign destination.  

Source: JLARC staff analysis.

Transportation industries that benefit from preferences employ more than 31,000 people

The truck, rail, water, and pipeline transportation industries included over 2,800 businesses and employed more than 31,000 people in 2021.

Exhibit 1.2: Rail, truck, water, and pipeline industries employed more than 31,000 people in Washington (2021)
Transportation Industry 2021 Businesses1 2021 Employment2 Median Annual Wage2
Truck 2,711 24,060 $50,820
Rail 29 4,550 $64,280
Water 57 2,600 $77,100
Pipeline 36 250 $99,040
Sources: JLARC staff analysis of data from (1) BLS 2021 Quarterly Census of Employment and Wages (QCEW) and WSDOT and (2) Bureau of Labor Statistics (BLS) April 2021 Occupational Employment and Wage Statistics Data (OEWS).

As part of the Legislature's direction to include racial equity analysis into its evaluations, JLARC staff compiled industry-level race and ethnicity data from the U.S. Census Bureau's Longitudinal Employer-Household Dynamics program. In the absence of specific data about beneficiaries and their employees, the following is intended to provide the Legislature with insight into the racial and ethnic characteristics of people who work in the industries that benefit from the tax preferences.

Exhibit 1.3: Census data describes race and ethnicity of transportation industry employees
Race/ethnicity of transportation industry employees
White Black or African American Asian Two or More Races American Indian or Alaska Native Native Hawaiian or Other Pacific Islander Hispanic/ Latino of any race
Statewide 66.1% 4.5% 12.4% 3.2% 0.7% 0.7% 12.4%
Truck 71.0% 5.5% 4.3% 2.9% 1.0% 1.2% 14.1%
Rail Data unavailable for rail transportation.
Water 78.9% 4.4% 6.1% 2.7% 0.6% 1.3% 6.0%
Pipeline 84.5% 2.9% 2.1% 2.5% 0.0% 0.0% 7.6%
Sources: JLARC staff analysis of data from U.S. Census Longitudinal Employer-Household Dynamics. The percentages shown for race and ethnicity are based on employment figures from the BLS 2021 Quarterly Census of Employment and Wages (QCEW).

The transportation sector and freight-dependent industries comprise a significant share of Washington's economy

The preferences directly reduce taxes for four transportation industries. Other businesses may benefit indirectly. For example, lower tax costs for transportation could lower costs for freight-dependent industries (i.e., those that rely heavily on the multimodal freight system to remain competitive).

The Washington State Department of Transportation (WSDOT) identifies the following as freight-dependent industries: Construction and Quarrying (excluding oil and gas); Transportation; Agriculture, Seafood, and Forestry; Energy (petroleum and coal products manufacturing); Wholesale, Warehousing, and Storage; Manufacturing; and Retail, Dining, and Waste Disposal.

The transportation sector and these freight-dependent industries contributed 34% of the state's Gross Domestic Product (GDP) in 2021. They also made up 45% of private sector jobs and 41% of private sector wages in Washington. The transportation sector includes the preferences' direct beneficiaries (e.g., truck transportation) and other industries (e.g., air transportation and support activities for transportation).

Exhibit 1.4: Transportation sector and freight-dependent industries contribute 34% of Washington GDP

Bar graph showing that transportation and freight-dependent industries contributed 34% of Washington's GDP in 2021.

Source: JLARC staff analysis of 2021 BEA, BLS-QCEW data.
Note: Exhibit 1.4 includes GDP contributions from the entire transportation sector, including the direct beneficiaries and other industries (e.g., air transportation and support activities for transportation).

23-05 Final Report: Interstate Transportation

November 2023

Review Details

2. Citizen Commission requested economic analysis

Citizen Commission requested economic analysis of repealing the preferences

Original objective of constitutional compliance is no longer relevant

Three of the preferences were initially enacted in the 1930s to comply with the Commerce Clause of the U.S. Constitution. The clause held that a state tax on any portion of interstate transportation activities would be a burden on interstate commerce and, therefore, unconstitutional.

In 1977, the Supreme Court stated that a gross income tax on interstate transportation would be constitutional if it was properly apportioned and met other criteria. Today, 45 other states tax the earnings of the in-state portion of interstate transportation services.

JLARC's 2010 review determined that the preferences were no longer needed to comply with the Constitution. The Legislative Auditor recommended that the Legislature repeal two of the preferences and clarify the third.

Citizen Commission requested economic impact analysis

In 2010, the Citizen Commission for Performance Measurement of Tax Preferences (Commission) agreed that the preferences were no longer constitutionally necessary. However, it did not endorse the recommendations to repeal the in-state portion and through-freight preferences.

The Commission noted that affected taxpayers had structured their business activities on the assumption that the preferences would exist. Noting that termination could have unintended negative consequences, the Commission called for an economic impact study of repealing the preferences.

Preferences improve the competitiveness of the transportation industry in Washington

This report provides the economic analysis requested by the Commission. The analyses illustrate different ways in which the preferences affect the competitiveness of the transportation industry in Washington:

  1. The preferences saved beneficiaries an estimated $87 million in 2022 (Section 3).
  2. The preferences make Washington taxes on interstate rail and truck less than the average of ten comparison states (Section 4).
  3. The preferences lower the cost of transporting import and export freight through Washington. The lower costs support higher port volume than if the preferences were not available (Section 4).
  4. The preferences reduce the cost of transportation services, supporting additional employment for the Washington transportation industry and its customers (Section 5).

Legislature may have other objectives for the preferences

The inferred objective of the fourth preference (shipping farm products to ports) is to authorize a historically allowed exemption. The 2020 review of the preference found that it met the objective and the Legislative Auditor recommended continuation.

The Legislature has considered various bills to change the first three preferences. This suggests that there may be other policy objectives. Most recently, legislation introduced in 2010, 2013, and 2023 would have taxed some portion of the activity that the preferences currently exempt. These bills did not pass.

23-05 Final Report: Interstate Transportation

November 2023

REVIEW Details

3. Taxpayer savings were $87 million in FY 2022

Preferences saved beneficiaries an estimated $87 million in 2022

JLARC staff used federal data to estimate taxpayer savings from fiscal year 2022 through 2029 (Appendix A). The analysis:

What is a ton-mile?
A ton-mile is a measure that represents moving one ton of freight for one mile.
  1. Estimated how many ton-miles of freight in Washington qualify for the preference.
  2. Estimated the gross earnings for moving the freight in Washington based on federal data for average revenue per ton-mile.
  3. Calculated savings by multiplying gross earnings by the applicable public utility tax (PUT) rate. PUT rates for transportation services in this estimate range from 1.3696% to 1.926%.

The analysis considered transportation mode (e.g., truck, rail) and the goods being shipped.

JLARC staff estimate taxpayers that used the preference saved $87.2 million in fiscal year 2022. The savings are expected to grow each year because the federal data assumes that both the amount of freight and the cost to transport it will increase.

Exhibit 3.1: Beneficiary savings are estimated to increase to $220 million in the 2027-29 biennium
Biennium Fiscal Year In-state Portion and Through Freight Shipments to Port Shipping Farm Products to Port Total Beneficiary Savings
2021-23

7/1/21-6/30/23

2022 $76,700,000 $10,500,000 $50,000 $87,200,000
2023 $79,500,000 $10,900,000 $50,000 $90,500,000
2023-25

7/1/23-6/30/25

2024 $82,700,000 $11,300,000 $50,000 $94,100,000
2025 $85,900,000 $11,700,000 $50,000 $97,700,000
2025-27

7/1/25 - 6/30/27

2026 $88,900,000 $12,200,000 $50,000 $101,200,000
2027 $91,900,000 $12,700,000 $50,000 $104,700,000
2027-29

7/1/27-6/30/29

2028 $94,900,000 $13,200,000 $50,000 $108,200,000
2029 $98,000,000 $13,600,000 $50,000 $111,700,000
2027-29 biennium $192,900,000 $26,800,000 $100,000 $219,800,000
Source: JLARC staff estimates based on federal Freight Analysis Framework data.

23-05 Final Report: Interstate Transportation

November 2023

REVIEW Details

4. Preferences help Washington businesses stay competitive

Preferences kept Washington taxes below a ten-state average. They support Washington port traffic.

With preferences, Washington taxes on interstate rail and truck transportation are lower than the average of 10 comparison states

Exhibit 4.1: Analysis compared tax burden in Washington and 10 other states
Map of the U.S. highlighting Washington and the 10 comparison states: California, Idaho, Illinois, Louisiana, Nevada, New Jersey, Ohio, Oregon, Texas, and Virginia.
Source: JLARC staff summary of EY analysis.

JLARC staff hired a tax accounting consultant to compare the estimated tax burdens for rail and truck transportation in Washington and 10 other states (California, Idaho, Illinois, Louisiana, Nevada, New Jersey, Ohio, Oregon, Texas, and Virginia).

  • Rail and truck transportation represent the largest share of estimated beneficiary savings (17% and 60%, respectively) compared to other modes of transportation.
  • The 10 states are near Washington, have large port facilities, and/or contain freight transportation hubs.

The analysis applies each comparison state's applicable taxes and apportionment rulesAssignment of income to states for tax purposes to financial information for hypothetical rail or truck businesses. The consultant also estimated the tax reduction from any tax preferences in each state. This step affected only Washington's taxes. The result is an estimate of the tax cost in each state, expressed as a rate of dollars per thousand ton-miles. Details are in Appendix B.

Rail: With or without preferences, Washington's taxes are lower than the average of other states

The analysis assumes that the hypothetical rail company earns all of its revenue through interstate transportation. Also, 25% of revenue miles occur inside each state.

  • With the preferences, Washington's taxes on interstate rail transportation are estimated to be $2.15 per thousand ton-miles. This is lower than the other 10 states.
  • Without the preferences, 25% of the firm's revenue miles would become subject to PUT in Washington. This would raise the tax cost per thousand ton-miles to $2.38. It would still be the second lowest of all 11 states.
  • With or without the preferences, Washington's tax cost for interstate rail transportation would remain below the average of comparison states.
Exhibit 4.2: Preferences reduce WA state tax on rail transportation to lowest among comparison states

Bar graph comparing state and local tax costs for Washington and ten other states for rail transportation.  The PUT exemptions reduce Washington taxes to below the average of the ten other states.

Source: EY analysis.

Truck: With preferences, Washington's taxes are lower than the average of other states

The analysis assumes that the hypothetical truck company is headquartered in each respective state and earns all of its revenue through interstate transportation. Also, 33% of revenue miles occur inside each state.

  • With the preferences, Washington's taxes on interstate truck transportation are estimated to be $2.18 per thousand ton-miles. This tax cost ranks fourth lowest among comparison states. It is below the average of the other ten states.
  • Without the preferences, 33% of the firm's revenue miles would become subject to PUT in Washington. This would raise the tax cost per thousand ton-miles to $3.19. Washington's tax cost would rise to third highest.
Exhibit 4.3: Preferences reduce state tax on truck transportation to fourth lowest among comparison states

Bar graph comparing state and local tax costs for Washington and ten other states for truck transportation.  The PUT exemptions reduce Washington taxes to below the average of the ten other states.

Source: EY analysis.

Without preferences, analysis shows that some imports and exports would be diverted to ports outside Washington

Stakeholders expressed concerns about the impact of repeal on port traffic. In general, the concerns can be summarized as follows:

  • Repealing the preferences could increase the cost of transporting freight through Washington.
  • Higher transportation costs could make Washington a relatively more expensive import and export route than competitor ports (e.g., Long Beach, California and Vancouver, British Columbia). This could result in a loss of freight volume.
  • A loss of freight volume would negatively affect economic activity for the ports and for the transportation industries that handle import and export freight.

To estimate the impact of imposing the tax on port volume, JLARC staff worked with Dr. Robert Leachman, an expert in supply chains and economic analysis of freight transportation. He analyzed the potential diversion of marine imports and exports.

  • Imports: The analysis is based on estimated 2019 import volumes for over 100 importers. The model optimizes supply chains for containerized freight that is shipped by water from southeast Asia to the U.S. It concludes that repealing the preferences (i.e., imposing the PUT) could divert an estimated 0.16% of containerized imports away from the ports of Seattle and Tacoma to competitor ports.
  • Exports: The analysis used 2019 data to estimate the amount of freight by commodity, the origin of different bulk grains, and the ways grain might be transported. Based on these estimates, the analysis concludes that 0.5% of containerized exports and 2.7% of grain exports could be diverted to competitor ports.

The full report is in Appendix C.

Exhibit 4.4: Imposing the PUT could divert an estimated 0.16% of containerized imports and 2.7% of grain exports

Trade Type Freight Type Volume diversion Notes
Import Containerized -0.16%
  • Containerized: Freight transport where freight is loaded into standardized shipping containers
  • Bulk: Commodity cargo that is transported unpackaged in large quantities
Export Containerized -0.5%
Export Bulk Grain -2.7%
Source: Leachman Consulting.

23-05 Final Report: Interstate Transportation

November 2023

REVIEW Details

5. Without the preferences, private sector employment would decline

Economic model: without the preferences, employment in private industries would decline and government spending and employment would increase

When the preferences were reviewed in 2010, the Citizen Commission for Performance Measurement of Tax Preferences recommended an analysis of the economic impact of their repeal (see 2010 tax performance review report, page 15).

For this report, JLARC staff used REMI (Regional Economic Models, Inc. – economic modeling software) to conduct that analysis. Appendix D describes the model used. Appendix E provides details about the methodology.

Impact of repeal can be modeled by increasing production cost and government spending

If the Legislature repealed the preferences, transportation businesses would pay more public utility tax. The tax revenue would accrue to the state general fund. JLARC staff assumed the increased tax would be equal to the beneficiary savings (i.e., $87 million in fiscal year 2022). Staff used two types of inputs to model these changes:

  1. An increase in production cost for affected industries (e.g., transportation, freight-dependent industries). Public testimony from 2010 and interviews with current stakeholders suggest that transportation businesses would likely raise prices to pass some of the additional tax cost to customers.
  2. An increase in state government spending in proportion to how the current state budget is spent. The government spending increase is assumed to be the same for both scenarios below.

Model suggests repeal would lead to a net loss in private sector jobs and a net gain in public sector jobs

In general, the model shows:

  • Increased production cost leads to a loss of jobs. These job losses occur primarily in the private sector, but public sector job losses occur as well.
  • Increased government spending leads to an increase in jobs. The job increase occurs in both the public sector (925 jobs) and private sector (945 jobs).

Both the net employment change and the industries that are affected depend, in part, on the degree to which transportation businesses pass the costs to their customers. To illustrate the range of possible results, JLARC staff modeled multiple scenarios for the production cost increase and present two here.

Scenario A assumes the transportation industries do not pass the additional tax to their customers

The model applies all of the production cost increase to the transportation businesses that are direct beneficiaries of the tax preferences. In this scenario, private sector employment is estimated to decrease by a net of 785 jobs:

  • The rail, truck, water, and pipeline transportation industries lose the most jobs (330). These industries bear all production cost increases.
  • Other private industries lose a combined 455 jobs. The largest job losses are in construction (105), manufacturing (70), and retail trade (65).

After considering a net increase of 745 jobs in state government, the estimated net employment change statewide is a loss of 40 jobs.

Exhibit 5.1: Scenario A. If the preference beneficiaries pass none (0%) of the tax cost to customers, the private sector is estimated to lose 785 jobs.
Sector Industry Job losses

(production cost increase)

Job gains

(government spending increase)

Net jobs change
Private Transportation -385 55 -330
Other Private -1,345 890 -455
Total Private -1,730 945 -785
Public Government -180 925 745
Total -1,910 1,870 -40
Source: JLARC staff analysis.

Scenario B assumes the transportation industries pass all of the additional cost to their customers

The model applies all of the production cost to the Washington industries that are assumed to produce or use the transported commodities.

In this scenario, private sector employment is estimated to decrease by a net of 860 jobs.

  • Transportation would have a net loss of 100 jobs.
  • Other private industries lose a combined 760 jobs. The large job losses are in manufacturing (385), farming (135), forestry, fishing, and hunting (50), and retail trade (45).

After considering an increase of 760 jobs in state government, the estimated net employment change statewide is a loss of 100 jobs.

Exhibit 5.2: Scenario B. If the preference beneficiaries pass all (100%) of the tax cost to customers, the private sector is estimated to lose 860 jobs.
Sector Industry Job losses

(production cost increase)

Job gains

(government spending increase)

Net change in jobs
Private Transportation -155 55 -100
Other Private -1,650 890 -760
Total Private -1,805 945 -860
Public Government -165 925 760
Total -1,970 1,870 -100
Source: JLARC staff analysis.

23-05 Final Report: Interstate Transportation

November 2023

Review Details

6. Applicable statutes

RCW 82.16.050(6, 8-10)

Deductions in computing tax.

RCW 82.16.050

In computing tax there may be deducted from the gross income the following items:

  1. Amounts derived by municipally owned or operated public service businesses, directly from taxes levied for the support or maintenance thereof. This subsection may not be construed to exempt service charges which are spread on the property tax rolls and collected as taxes;
  2. Amounts derived from the sale of commodities to persons in the same public service business as the seller, for resale as such within this state. This deduction is allowed only with respect to water distribution, gas distribution or other public service businesses which furnish water, gas or any other commodity in the performance of public service businesses;
  3. Amounts actually paid by a taxpayer to another person taxable under this chapter as the latter's portion of the consideration due for services furnished jointly by both, if the total amount has been credited to and appears in the gross income reported for tax by the former;
  4. The amount of cash discount actually taken by the purchaser or customer;
  5. The amount of bad debts, as that term is used in 26 U.S.C. Sec. 166, as amended or renumbered as of January 1, 2003, on which tax was previously paid under this chapter;
  6. Amounts derived from business which the state is prohibited from taxing under the Constitution of this state or the Constitution or laws of the United States;

  7. Amounts derived from the distribution of water through an irrigation system, for irrigation purposes other than the irrigation of cannabis as defined under RCW 69.50.101;
  8. Amounts derived from the transportation of commodities from points of origin in this state to final destination outside this state, or from points of origin outside this state to final destination in this state, with respect to which the carrier grants to the shipper the privilege of stopping the shipment in transit at some point in this state for the purpose of storing, manufacturing, milling, or other processing, and thereafter forwards the same commodity, or its equivalent, in the same or converted form, under a through freight rate from point of origin to final destination;

  9. Amounts derived from the transportation of commodities from points of origin in the state to an export elevator, wharf, dock or ship side on tidewater or its navigable tributaries to be forwarded, without intervening transportation, by vessel, in their original form, to interstate or foreign destinations. No deduction is allowed under this subsection when the point of origin and the point of delivery to the export elevator, wharf, dock, or ship side are located within the corporate limits of the same city or town;

  10. Amounts derived from the transportation of agricultural commodities, not including manufactured substances or articles, from points of origin in the state to interim storage facilities in this state for transshipment, without intervening transportation, to an export elevator, wharf, dock, or ship side on tidewater or its navigable tributaries to be forwarded, without intervening transportation, by vessel, in their original form, to interstate or foreign destinations. If agricultural commodities are transshipped from interim storage facilities in this state to storage facilities at a port on tidewater or its navigable tributaries, the same agricultural commodity dealer must operate both the interim storage facilities and the storage facilities at the port.

    1. The deduction under this subsection is available only when the person claiming the deduction obtains a certificate from the agricultural commodity dealer operating the interim storage facilities, in a form and manner prescribed by the department, certifying that:

      1. More than ninety-six percent of all of the type of agricultural commodity delivered by the person claiming the deduction under this subsection and delivered by all other persons to the dealer's interim storage facilities during the preceding calendar year was shipped by vessel in original form to interstate or foreign destinations; and

      2. Any of the agricultural commodity that is transshipped to ports on tidewater or its navigable tributaries will be received at storage facilities operated by the same agricultural commodity dealer and will be shipped from such facilities, without intervening transportation, by vessel, in their original form, to interstate or foreign destinations.

    2. As used in this subsection, "agricultural commodity" has the same meaning as agricultural product in RCW 82.04.213;

  11. Amounts derived from the production, sale, or transfer of electrical energy for resale within or outside the state or for consumption outside the state;
  12. Amounts derived from the distribution of water by a nonprofit water association and used for capital improvements by that nonprofit water association;
  13. Amounts paid by a sewerage collection business taxable under RCW 82.16.020(1)(a) to a person taxable under chapter 82.04 RCW for the treatment or disposal of sewage;
  14. Amounts derived from fees or charges imposed on persons for transit services provided by a public transportation agency. For the purposes of this subsection, "public transportation agency" means a municipality, as defined in RCW 35.58.272, and urban public transportation systems, as defined in RCW 47.04.082. Public transportation agencies must spend an amount equal to the reduction in tax provided by this tax deduction solely to adjust routes to improve access for citizens using food banks and senior citizen services or to extend or add new routes to assist low-income citizens and seniors.

[ 2022 c 16 § 162; 2014 c 140 § 25; 2007 c 330 § 1; 2006 c 336 § 1; 2004 c 153 § 308; 2000 c 245 § 1; 1994 c 124 § 12; 1989 c 302 § 103; 1987 c 207 § 1; 1982 2nd ex.s. c 9 § 3; 1977 ex.s. c 368 § 1; 1967 ex.s. c 149 § 25; 1965 ex.s. c 173 § 22; 1961 c 15 § 82.16.050. Prior: 1959 ex.s. c 3 § 18; 1949 c 228 § 11; 1937 c 227 § 12; 1935 c 180 § 40; Rem. Supp. 1949 § 8370-40.]

Notes:

Intent—Finding—2022 c 16: See note following RCW 69.50.101.

Retroactive effective date—Effective date—2004 c 153: See note following RCW 82.08.0293.

Effective date—Application—2000 c 245 § 1: "(1) Section 1 of this act is necessary for the immediate preservation of the public peace, health, or safety, or support of the state government and its existing public institutions, and takes effect immediately [March 31, 2000]. (2) Section 1 of this act applies to all amounts due prior to and after March 31, 2000." [ 2000 c 245 § 3.]

Finding, purpose—1989 c 302: See note following RCW 82.04.120.

Effective date—1982 2nd ex.s. c 9: See note following RCW 82.16.010.

23-05 Final Report: Interstate Transportation

November 2023

Review Details

Appendix A: Bureau of Transportation Statistics data

Two sources of Bureau of Transportation Statistics data inform JLARC analysis

This appendix describes the data that informed JLARC staff's estimate of taxpayer savings and, subsequently, of the economic impact of the preferences. These analyses rely on two data products produced by the U.S. Department of Transportation's Bureau of Transportation Statistics (BTS):

  • Freight Analysis Framework (FAF).
  • Freight revenue per ton-mile.

Freight Analysis Framework data describes estimates of freight movement into, out of, and within Washington

The Freight Analysis Framework (FAF) provides data on freight movement among states and major metropolitan areas by all modes of transportation. The FAF integrates data from a variety of sources. Starting with data from the Commodity Flow Survey (CFS) and international trade data from the Census Bureau, FAF incorporates data from agriculture, extraction, utility, construction, service, and other sectors. The FAF is produced through a partnership between BTS and the Federal Highway Administration.

The data includes tonnage, value, and ton-miles by trade type, origin and destination state, commodity type, and mode. It is benchmarked to the 2017 Commodity Flow Survey. Weights are in thousands of tons, activity is in millions of ton-miles, and values are in millions of 2017 constant dollars. The data includes estimates for the base year (2017), annual estimates for 2018-2020, and forecast estimates for 2022-2050.

FAF data characteristics

JLARC staff analyzed available characteristics of FAF data to develop the savings estimate.

Freight Flow is described by origin and destination states: FAF data includes two characteristics that allow JLARC staff to evaluate the direction of freight flows. By grouping data by origin state and destination state, JLARC staff describe three distinct types of freight flows.

Exhibit A.1: Freight flows dictated by origin and destination states
Origin State Destination State Freight Flow
Washington Washington Within Washington
All Other States Washington Inbound to Washington
Washington All Other States Outbound from Washington
Source: FAF 5.4-State.

Trade types include domestic, import, and export. Trade categories further inform the direction of freight movement.

Exhibit A.2: FAF data includes three trade types
Code Trade
1 Domestic Only
2 Import
3 Export
SOURCE: FAF5.4-Trade.
Exhibit A.3: Freight Flow and Trade together describe nine distinct trade-flow combinations
Chart showing 9 combinations of trade and freight flow direction.  Trade types are domestic, import, and export. Freight flow directions are within Washington, inbound to Washington, and outbound from Washington.
Source: JLARC staff analysis of FAF5.4 data.

JLARC staff analysis of FAF data focused on 5 of 8 modes

JLARC staff analysis of the preferences and other statutes suggests the preferences apply to the five transportation modes emphasized in Exhibit A.4. Staff therefore included FAF data from these modes in its savings estimate. Each observation in the data includes one "domestic mode" type to describe the mode by which the freight was moved inside the United States. For import and export freight, the data also includes foreign in-mode and foreign out-mode to describe the mode by which the freight entered or left the United States, respectively. The category "Multiple Modes & Mail" can include anything from containerized cargo to coal moving from mine to railhead by truck and rail to harbor. The "Mail" component recognizes that shippers who use parcel delivery services typically do not know what modes were involved after the shipment was picked up. For the purposes of the analysis, JLARC staff distributed these shipments to the other 4 modes in proportion.

Exhibit A.4: JLARC staff analysis focused on 5 of 8 transportation modes
Code Mode
1 Truck
2 Rail
3 Water
4 Air (include truck-air)
5 Multiple modes & mail
6 Pipeline
7 Other and unknown
8 No domestic mode
Source: FAF5.4 - Mode.

Freight data summarized by 42 commodity types

Analyzing FAF data by commodity allowed JLARC staff to match estimated beneficiary savings to specific freight-dependent industries. Appendix E provides a commodity-to-industry crosswalk.

Exhibit A.5: FAF data includes 42 commodity types

Scroll to view all data

Code Commodity
01 Live animals/fish
02 Cereal grains
03 Other agricultural products
04 Animal feed
05 Meat/seafood
06 Milled grain products
07 Other foodstuffs
08 Alcoholic beverages
09 Tobacco products
10 Building stone
11 Natural sands
12 Gravel
13 Nonmetallic minerals
14 Metallic ores
15 Coal
16 Crude petroleum
17 Gasoline
18 Fuel oils
19 Coal-n.e.c.
20 Basic chemicals
21 Pharmaceuticals
22 Fertilizers
23 Chemical products
24 Plastics/rubber
25 Logs
26 Wood products
27 Newsprint/paper
28 Paper articles
29 Printed products
30 Textiles/leather
31 Nonmetal mineral products
32 Base metals
33 Articles-base metal
34 Machinery
35 Electronics
36 Motorized vehicles
37 Transport equipment
38 Precision instruments
39 Furniture
40 Miscellaneous manufactured products
41 Waste/scrap
43 Mixed freight
Source: BTS-Standard Classification of Transported Goods. Source data does not include commodity code 42.

BTS publishes average freight revenue per ton-mile for various transportation modes

The BTS data shows that freight revenue per ton-mile has historically trended upward for all modes of transportation, with the largest increases for oil pipelines and trucks, and the least increase for railroad. JLARC staff projected these trends forward to inform the beneficiary savings estimate in future years.

Exhibit A.6: Modal estimates of freight revenue per ton-mile inform staff estimate of beneficiary savings
Line graph showing projected freight revenue per ton-mile for four transportation modes: truck transportation, rail transportation, water transportation, and pipeline transportation. Truck transportation revenue is higher than the other three modes.
Source: JLARC staff analysis of BTS-Freight Revenue per Ton-Mile.

23-05 Final Report: Interstate Transportation

November 2023

Review Details

Appendix B: Ernst & Young analysis

JLARC contracted with Ernst & Young to compare state taxation of rail and truck transportation in Washington and comparison states

JLARC contracted with Ernst & Young (EY) to analyze the state and local tax climate for rail and truck transportation industries in Washington and ten comparison states. JLARC staff selected these modes because they represent the largest share of estimated beneficiary savings. EY compared estimates of the operating tax burdens for hypothetical firms in each industry.

The following states were selected for comparison because they are near Washington, have large port facilities, and/or contain freight transportation hubs:

  • California.
  • Idaho.
  • Illinois.
  • Louisiana.
  • Nevada.
  • New Jersey.
  • Ohio.
  • Oregon.
  • Texas.
  • Virginia.

The industries included in the analysis and their North American Industry Classification System (NAICS) codes are:

  • 482-Rail Transportation.
  • 484-Truck Transportation.

Consultant modeled scenarios for intrastate and interstate transportation providers

The consultant estimated the tax burdens faced by representative interstate rail and trucking companies operating in Washington and a set of comparison states. The focus of the analysis is on operating taxes and does not include taxation of capital investments (e.g., rail cars).

Overview of approach

The consultant developed an operating profile for representative rail and truck transportation companies. The profile for the rail company is based on the financial and operating characteristics of the seven Class I rail companies as reported by the Surface Transportation Board and other sources. These companies accounted for 68% of U.S. freight rail mileage and 94% of revenue in 2020. The operating profile for the representative truck company is based on data sources such as the Census Bureau, IRS Statistics of Income, and the Federal Highway Administration for the truck transportation subsector (NAICS 484). Each representative firm's operating profile includes data on revenue, net operating income, operating expenses, and property values, reported as dollars per thousand ton-miles.

Exhibit B.1: Consultant developed operating profiles for representative rail and truck firms
Rail Truck
Industry definition Class I Rail Truck Transportation

(NAICS 484)

Interstate miles: in-state/out-of-state share 25%/75% 33%/67%
Net operating income/revenue 28.8% 6.5%
Tax base information (per thousand ton-miles)
Annual revenue* $48.46 $157.05
Operating expenses* $30.05 $128.55
Net operating income* $13.96 $10.24
Real and personal property* $177.42 $49.25
* Values are expressed as dollars per thousand ton-miles.
Source: EY analysis.

Taxes included in analysis

The consultant's analysis includes primary business taxes and other taxes that may affect the operating cost of the transportation firms. The primary business entity tax for most states is the corporate income tax. Washington and four other states impose a tax on gross receipts (in Washington, this is the public utility tax or PUT). Louisiana imposes a gross receipts tax on transportation companies in addition to the corporate income tax (Transportation and Communication Utilities tax). Rail companies in New Jersey are subject to the Railroad Franchise Tax in lieu of the state’s corporate income tax. Exhibit B.2 shows the taxes included in the analysis for each state.

Exhibit B.2: Consultant evaluated applicable tax programs in each state
Tax Type WA CA ID IL LA NV NJ OH OR TX VA
Corporate income X X X X X X X
Gross receipts X X X X X
Franchise X X X
Transportation X X
Sales and use X X X X X X X X X X
Real property X X X X X X X X X X X
Personal property X X X X X X X X
Diesel fuel X X X X X X X X X X X
Source: EY analysis.

Two scenarios illustrate effect of PUT tax preferences

The consultant modeled operating taxes in Washington and in other states using two scenarios. The first scenario, assuming all of a firm's revenue miles occur in interstate transportation, is also shown in Section 2 of the report. The second scenario assumes all revenue miles occur in intrastate transportation. In each scenario, the results show two values for Washington: with in-state miles subject to PUT and with in-state miles exempt from PUT. No other states offer comparable tax preferences, so the results show only one value for other states.

100% interstate scenario assumes all revenue miles occur in interstate transportation

Rail transportation results: For the hypothetical rail company, the analysis assumes all revenue is earned through interstate transportation, and that 25% of revenue miles occur inside each state while 75% occur outside each state. Washington's taxes on interstate rail transportation are estimated to be $2.15 per thousand ton-miles when the tax preferences are available and the rail company pays no PUT on its earnings for interstate transportation. This tax cost ranks lowest among comparison states. Exhibit B.3 shows that without the preferences, 25% of the firm's revenue miles would become subject to PUT in Washington, raising the mean tax cost per thousand ton-miles to $2.38. Washington's state taxation of interstate rail transportation would remain below the average of comparison states, ranking second lowest of 11 states.

Exhibit B.3: Preferences reduce state tax on interstate rail transportation to lowest among comparison states
Bar graph comparing state and local tax costs for Washington and ten other states for rail transportation.  The PUT exemptions reduce Washington taxes to below the average of the ten other states.
Source: EY analysis.

Truck transportation results: Exhibit B.4 shows the results for the hypothetical trucking company. The analysis assumes the hypothetical trucking company is headquartered in each respective state and earns all of its revenue through interstate transportation. Also, 33% of revenue miles occur inside each state while 67% occur outside each state. Washington's taxes on interstate truck transportation are estimated to be $2.18 per thousand ton-miles when the tax preferences are available and no PUT is imposed on earnings for interstate transportation. This tax cost ranks fourth lowest among comparison states and below the average of the other ten states. Without the preferences, 33% of the firm's revenue miles would become subject to PUT in Washington, raising the mean tax cost per thousand ton-miles to $3.19. In this case, Washington's state taxation of interstate truck transportation would rise to third highest, above the average of the comparison states.

Exhibit B.4: Preferences reduce state tax on interstate truck transportation to fourth lowest among comparison states
Bar graph comparing state and local tax costs for Washington and ten other states for truck transportation.  The PUT exemptions reduce Washington taxes to below the average of the ten other states.
Source: EY analysis.

100% intrastate scenario assumes all revenue miles occur within the state

This scenario models the operating taxes faced by a rail and a truck transportation firm that operates completely within a given state. The results for Washington reflect the tax cost of having all revenue miles subject to the PUT or none of the miles being subject to the PUT. Although wholly intrastate trips are generally subject to Washington PUT, the "Shipments to Port" and "Shipping Farm Products to Port" preferences provide PUT exemptions for the earnings from some intrastate transportation services. Thus, the results below can be construed to compare the unitized tax cost for intrastate transportation services when subject to PUT and when exempt from PUT.

Rail transportation results: For the intrastate rail company, when subject to PUT, the tax cost is $3.08 per thousand ton-miles. This is fourth lowest among comparison states. When exempting the earnings from PUT, Washington's tax falls to $2.15 per thousand ton-miles, lowest among states.

Exhibit B.5: Without preferences, state tax on intrastate rail transportation is fourth lowest among comparison states
Bar graph comparing state and local tax costs for Washington and ten other states for wholly intrastate rail transportation.  The PUT exemptions reduce Washington taxes to below the average of the ten other states.
Source: EY analysis.

Truck transportation results: For the intrastate trucking company, when subject to PUT, the tax cost is second highest among comparison states at $5.20 per thousand ton-miles. When exempting the earnings from PUT, Washington's tax falls to $2.18 per thousand ton-miles, second lowest among states.

Exhibit B.6: Without preferences, state tax on intrastate truck transportation is second highest among comparison states
Bar graph comparing state and local tax costs for Washington and ten other states for wholly intrastate truck transportation.  The PUT exemptions reduce Washington taxes to below the average of the ten other states.
Source: EY analysis.

Full Ernst & Young Report available

Click here for the full EY report, which provides additional detail about the methodology, data sources, and results of the analysis.

23-05 Final Report: Interstate Transportation

November 2023

Review Details

Appendix C: Consultant's import/export diversion analysis

JLARC worked with expert in supply chain economics to estimate magnitude of freight diversion if preferences were repealed

JLARC staff contracted with Dr. Robert Leachman, a professor of Industrial Engineering and Operations Research at the University of California, Berkeley, to analyze the impact that repealing the tax preferences might have on the import and export volumes through Washington marine ports. Dr. Leachman's research interests include economic analysis of import supply chains. He is the author of more than 50 technical publications concerning production and operations management, including several that focus on the flow of freight between Asia and the United States. 

JLARC staff used the estimated diversions identified below to inform the economic impact analysis using the REMI model described in Appendix E).

Dr. Leachman modeled scenarios for imports into Washington ports and exports out of Washington ports

Overview of approach: imports

The consultant assessed the impact of the public utility tax (PUT) on imports using an elasticity model that optimizes supply chains of waterborne containerized freight from southeast Asia to the United States. The model includes estimated 2019 import volumes for the top 90 actual importers and 16 generic importers to simulate small and regional importers. Total imports attributed to these actual and generic importers sum to the actual distribution imports according to 2019 U.S. Customs data. The consultant's model minimizes the total transportation, handling, and inventory costs for importers of marine freight. Comparing results before and after imposing the PUT on the Washington portion of interstate freight allows for an analysis of the volume of freight that might be routed to other ports as a result of repealing the preferences.

The model estimates that repealing the preferences would divert between 2,000 and 2,500 twenty-foot-equivalent units (TEUs) of containerized imports away from the Ports of Seattle and Tacoma to other ports outside Washington. This diversion represents 0.16% of the total 2019 containerized import volume at these ports of 1.39 million TEUs.

Overview of approach: exports

To assess the impact of the PUT on exports, the consultant analyzed Freight Analysis Framework 5 (FAF5) data on waterborne exports in calendar year 2019. The consultant also compared data from the Northwest Seaport Alliance (NWSA) ports on containerized exports to the FAF5 totals to estimate bulk and break-bulk tonnages by commodity group. The consultant used additional data sources to estimate the origin mix and domestic mode mix for bulk shipments of cereal grains (principally grain and corn), other agricultural products (principally soybeans), and other prepared foodstuffs (principally soybean meal). The consultant estimated the increase in transportation costs if the preferences were repealed and estimated the amount of exports that would be diverted to ports outside Washington. The diversion estimates are the professional judgments of the consultant, who notes there is not enough data available to compute diversions as was done for the import analysis.

  • In aggregate, the consultant estimates that removing Washington's PUT exemptions (i.e., repealing the preferences) would decrease exports of grain, including wheat, corn and soybeans from Columbia River and Puget Sound bulk export facilities, by 1.1 million metric tons, or 2.7%.
  • For containerized exports, only shipments originating outside the Pacific Northwest and Northern Plains states are susceptible to diversion from the potential PUT. The consultant estimates 4,300 TEUs or 0.5% of containerized exports via the Ports of Seattle and Tacoma would be diverted to ports outside Washington if the state imposed the PUT.

The consultant adds that other factors such as commodity prices, transportation prices, and labor disputes also affect import and export volumes.

Full reports available

Dr. Leachman's full reports provide additional detail about the methodology, data sources, and results of the analyses:

Imports analysis.

Exports analysis.

23-05 Final Report: Interstate Transportation

November 2023

Review Details

Appendix D: What is REMI?

What is REMI?

JLARC staff used Regional Economic Models, Inc.'s (REMI) single-region, 160 industry sector Tax-PI software (version 3.0) to model the economic impacts of the public utility tax (PUT) exemptions for interstate transportation.

Multiple state governments, private sector consulting firms, and research universities also use REMI's dynamic economic modeling to evaluate policy impacts.

Model is tailored to Washington and includes a government sector

Tax-PI is an economic impact tool used to evaluate the fiscal and economic effects and the demographic impacts of a tax policy change. The software includes various features that make it particularly useful for analyzing the economic and fiscal impacts of tax preferences:

  • REMI staff consulted with staff from the Office of Financial Management (OFM) and customized a statewide model to reflect Washington's economy.
  • The model contains 160 industry sectors, based on the North American Industry Classification system (NAICS) codes.
  • In contrast to other modeling software, Tax-PI includes state and local government as a sector. This permits users to see the trade-offs associated with tax policy changes (e.g., effects on Washington's economy from both increased expenditures by businesses due to a tax preference, along with decreased spending by government due to the associated revenue loss).
  • For current revenue and expenditure data, users can input information to reflect their state's economic and fiscal situation. This allows JLARC staff to calibrate a state budget using up-to-date information from the Economic and Revenue Forecast Council (ERFC) and the Legislative Evaluation and Accountability Program (LEAP).
  • The model can forecast economic and revenue impacts multiple years into the future.

Model simulates the full impact of a tax policy change

The REMI model accounts for direct, indirect, and induced effects as they spread through the state's economy, which allows users to simulate the full impact of a tax policy change over time.

  • Direct effects are industry specific and capture how a target industry responds to particular policy change (e.g., changes in industry employment following a change in tax policy).
  • Indirect effects capture employment and spending decisions by businesses in the targeted industry's supply chain that provide goods and services.
  • Induced effects capture the in-state spending and consumption habits of employees in targeted and related industries.

The REMI model produces year-by-year estimates of the total statewide effects of a tax policy change. Impacts are measured as the difference between a baseline economic and revenue forecast and an economic and revenue forecast after incorporating the policy change.

Model includes economic, demographic, and fiscal variables

The REMI model is a macroeconomic impact model that incorporates aspects of four major economic modeling approaches: input-output, general equilibrium, econometric, and new economic geography. The foundation of the model, the inter-industry matrices found in the input-output models, captures Washington's industry structure and the transactions between industries. Layered on top of this structure is a complex set of mathematical equations used to estimate how private industry, consumers, and state and local governments respond to a policy change over time.

  • The supply side of the model includes many economic variables representing labor supply, consumer prices, and capital and energy costs.
  • Regional competitiveness is modeled via imports, exports, and output.
  • Demographics are modeled using population dynamics (births, deaths, and economic and retirement migration) and include cohorts for age, sex, race, and retirement.
  • Demographic information informs the model's estimates for economic consumption and labor supply.
  • The dynamic aspect comes from the ability to adjust variables over time as forecasted economic conditions change.

While the model is complex and forecasting involves some degree of uncertainty, Tax-PI provides a tool for practitioners to simulate how tax policy and the resulting industry changes affect Washington's economy, population, and fiscal situation.

23-05 Final Report: Interstate Transportation

November 2023

Review Details

Appendix E: REMI Analysis

REMI analysis shows the range of potential employment impacts if the Legislature removes the PUT preferences

JLARC staff used REMI's single-region, 160 industry sector Tax-PI software (version 3.0) to model scenarios that illustrate potential employment effects if the interstate transportation tax preferences were removed.

This appendix provides context and supporting information for the analysis summarized in Section 2 of the report.

Modeled scenarios estimate the employment impact if the tax preferences were removed

JLARC staff developed REMI scenarios that illustrate repeal of the public utility tax (PUT) exemptions. The scenarios include two main policy changes modeled against REMI's baseline forecast of the Washington economy:

  1. Repealing the preferences would increase production costs for industries that currently benefit directly or indirectly from the preferences.
  2. Repealing the preferences would result in increased tax revenue, which the state would spend on its operating budget.

The scenarios differ in the assumption for who bears the cost of the additional tax: the transportation companies that provide transportation services or the industries that rely on freight transportation to operate. Both scenarios assume the additional PUT would result in some imports and exports being diverted to ports outside Washington.

Model inputs based on beneficiary savings

These inputs are based on JLARC staff estimates of taxpayer savings derived from FAF data, disaggregated by trade type and direction of flow (see Appendix A). Taxpayer savings estimates are divided into nine different trade/flow combinations, eight of which are assumed to comprise freight movements that the preferences exempt from PUT. Domestic freight originating and terminating in Washington is assumed to be subject to PUT and not in included in the analysis.

Exhibit E.1: Taxpayer savings disaggregated by trade type and direction of freight flow
Chart showing 9 combinations of trade and freight flow direction.  Trade types are domestic, import, and export. Freight flow directions are within Washington, inbound to Washington, and outbound from Washington.
Source: JLARC staff analysis.

Beneficiary savings estimates are summarized by commodity and associated with Washington industries

Staff summarized the taxpayer savings estimates by the 42 commodity types listed in (Appendix A) for each trade-flow combination with origin or destination in Washington. Staff associated each of the savings estimates to a relevant Washington industry using the following crosswalk, based on the “SCTG Industry to Washington Freight-Dependent Industry Crosswalk” on page 89 of Appendix C to WSDOT’s Draft Freight System Plan.

Where one commodity is associated with multiple industries, the value of the tax savings attributable to that commodity was shared among the relevant industries based on their relative industry size, measured by output in REMI’s baseline forecast.

Exhibit E.2: JLARC staff associated commodities in FAF data with Washington industries in REMI model

Scroll to see all data

Commodity Code Commodity Washington Industry in REMI

1

Live animals/fish

111, 112 - Farm

2

Cereal grains

111, 112 - Farm

3

Other agricultural products

111, 112 - Farm

4

Animal feed

3111 - Animal food manufacturing

5

Meat/seafood

3116 - Animal slaughtering and processing

3117 - Seafood product preparation and packaging

6

Milled grain products

3112 - Grain and oilseed milling

7

Other foodstuffs

3113 - Sugar and confectionery product manufacturing

3114 - Fruit and vegetable preserving and specialty food manufacturing

3115 - Dairy product manufacturing

3118 - Bakeries and tortilla manufacturing

3119 - Other food manufacturing

8

Alcoholic beverages

3121 - Beverage manufacturing

9

Tobacco products

3122 - Tobacco manufacturing

10

Building stone

3271 - Clay product and refractory manufacturing

3272 - Glass and glass product manufacturing

3273 - Cement and concrete product manufacturing

3274, 3279 - Lime, gypsum, and other nonmetallic mineral product manufacturing

11

Natural sands

2123 - Nonmetallic mineral mining and quarrying

12

Gravel

2123 - Nonmetallic mineral mining and quarrying

13

Nonmetallic minerals

2123 - Nonmetallic mineral mining and quarrying

14

Metallic ores

2122 - Metal ore mining

15

Coal

2121 - Coal mining

16

Crude petroleum

211 - Oil and gas extraction

17

Gasoline

324 - Petroleum and coal products manufacturing

18

Fuel oils

324 - Petroleum and coal products manufacturing

19

Coal-n.e.c.

2121 - Coal mining

20

Basic chemicals

3251 - Basic chemical manufacturing

21

Pharmaceuticals

3254 - Pharmaceutical and medicine manufacturing

22

Fertilizers

3253 - Pesticide, fertilizer, and other agricultural chemical manufacturing

23

Chemical products

3255 - Paint, coating, and adhesive manufacturing

3256 - Soap, cleaning compound, and toilet preparation manufacturing

3259 - Other chemical product and preparation manufacturing

24

Plastics/rubber

3252 - Resin, synthetic rubber, and artificial synthetic fibers and filaments manufacturing

25

Logs

113 - Forestry and Logging

26

Wood products

3211 - Sawmills and wood preservation

3212 - Veneer, plywood, and engineered wood product manufacturing

3219 - Other wood product manufacturing

27

Newsprint/paper

3221 - Pulp, paper, and paperboard mills

28

Paper articles

3222 - Converted paper product manufacturing

29

Printed products

323 - Printing and related support activities

30

Textiles/leather

313, 314 - Textile mills and textile product mills

315, 316 - Apparel, leather, and allied product manufacturing

31

Nonmetal mineral products

3274, 3279 - Lime, gypsum and other nonmetallic mineral product manufacturing

32

Base metals

3311 - Iron and steel mills and ferroalloy manufacturing

3312 - Steel product manufacturing from purchased steel

3313 - Alumina and aluminum production and processing

3314 - Nonferrous metal (except aluminum) production and processing

3315 - Foundries

33

Articles-base metal

3321 - Forging and stamping

3322 - Cutlery and handtool manufacturing

3323 - Architectural and structural metals manufacturing

3324 - Boiler, tank, and shipping container manufacturing

3325 - Hardware manufacturing

3326 - Spring and wire product manufacturing

3327 - Machine shops; turned product; and screw, nut, and bolt manufacturing

3328 - Coating, engraving, heat treating, and allied activities

3329 - Other fabricated metal product manufacturing

34

Machinery

3331 - Agriculture, construction, and mining machinery manufacturing

3332 - Industrial machinery manufacturing

3333 - Commercial and service industry machinery mfg, including digital camera mfg

3334 - Ventilation, heating, air-conditioning, and commercial refrigeration equipment manufacturing

3335 - Metalworking machinery manufacturing

3336 - Engine, turbine, and power transmission equipment manufacturing

3339 - Other general purpose machinery manufacturing

35

Electronics

3341 - Computer and peripheral equipment manufacturing, excluding digital camera manufacturing

3342 - Communications equipment manufacturing

3343 - Audio and video equipment manufacturing

3344 - Semiconductor and other electronic component manufacturing

3345 - Navigational, measuring, electromedical, and control instruments manufacturing

3346 - Manufacturing and reproducing magnetic and optical media

3351 - Electric lighting equipment manufacturing

3352 - Household appliance manufacturing

3353 - Electrical equipment manufacturing

3359 - Other electrical equipment and component manufacturing

36

Motorized vehicles

3361 - Motor vehicle manufacturing

3362 - Motor vehicle body and trailer manufacturing

3363 - Motor vehicle parts manufacturing

37

Transport equipment

3364 - Aerospace product and parts manufacturing

3365 - Railroad rolling stock manufacturing

3366 - Ship and boat building

3369 - Other transportation equipment manufacturing

38

Precision instruments

3333 - Commercial and service industry machinery mfg, including digital camera mfg

3343 - Audio and video equipment manufacturing

3344 - Semiconductor and other electronic component manufacturing

3345 - Navigational, measuring, electromedical, and control instruments manufacturing

3346 - Manufacturing and reproducing magnetic and optical media

3351 - Electric lighting equipment manufacturing

3352 - Household appliance manufacturing

3353 - Electrical equipment manufacturing

3359 - Other electrical equipment and component manufacturing

3391 - Medical equipment and supplies manufacturing

39

Furniture

3371 - Household and institutional furniture and kitchen cabinet manufacturing

3372, 3379 - Office furniture (including fixtures) mfg; Other furniture related product mfg

40

Miscellaneous manufactured products

315, 316 - Apparel, leather and allied product manufacturing

41

Waste/scrap

562 - Waste management and remediation services

43

Mixed freight

44-45 - Retail trade

722 - Food services and drinking places

Source: JLARC staff analysis of FAF data, WSDOT Freight System Plan.

The REMI model does not include an agriculture sector, so users cannot change that industry’s production cost. JLARC staff instead reduced farm output. The amount of the reduction is the taxpayer savings associated with agricultural products (cereal grains, other agricultural products, and live animals) multiplied by the ratio of production cost and output changes modeled in REMI for three related industries that are included in REMI: Forestry and logging; Fishing, hunting, and trapping; and Support activities for agriculture and forestry.

Two tax-incidence scenarios describe who absorbs increased PUT cost

Although transportation businesses would pay additional PUT, staff interviews and a review of public testimony suggest transportation businesses would likely pass on some of the additional tax cost to the freight-dependent industries that rely on transportation. The analysis does not assert the amount of additional tax cost that transportation companies would pass on to customers. Rather, JLARC staff analyzed two tax-incidence scenarios:

  1. Transportation companies pass on 0% of the tax cost to customers. In this scenario, the model increased production cost for truck, rail, water, and pipeline transportation in the amount of the savings estimates attributable to each transportation mode.
  2. Transportation companies pass on 100% of the tax cost to customers. In this case, the model increased production cost for the industries matched to each commodity. Where a commodity is associated with multiple industries, staff distributed production cost increases in proportion to each industry's baseline output.

Analysis includes adjustment for import and export freight diversion due to tax increase

Staff interviews and a review of 2010 public testimony indicated concern that the additional cost of transportation in Washington could result in diversion of marine freight away from Washington ports. Such diversion could negatively impact the economic activity of the ports themselves and of the transportation industry that moves cargo through, to, and from the ports. JLARC staff retained a consultant to analyze the potential diversion of marine imports and exports as a result of imposing the PUT on the Washington portion of interstate hauls.

The consultant's analysis estimates that imposing the PUT on the in-state portion of interstate transportation would divert 0.16% of containerized imports into Washington marine ports. The analysis estimates the additional tax cost would divert 0.5% of containerized exports and 2.7% of bulk grain exports out of Washington ports. The consultant's analysis is discussed in Appendix C.

Exhibit E.3: Consultant estimates import/export freight diversion without the preferences

Trade Type

Freight Type

Volume diversion

Import Containerized -0.16%
Export Containerized -0.5%
Export Bulk Grain -2.7%
Source: Leachman Consulting.

Policy variables used depend on nature of scenario

The REMI analysis is the sum of scenarios reflecting the eight different trade-flow combinations in Exhibit E.1. The policy variables used for each scenario differ, depending on characteristics of each trade-flow combination. Each scenario includes one or more of the following policy variables, defined below. Exhibits E.4 and E.5 indicate the policy variables used in the two respective scenarios:

  • Production Cost – Transportation Industries: The additional tax these industries are assumed to pay in the event the preferences were repealed.
  • Production Cost - Freight-Dependent Industries: Taxpayer savings per commodity type, attributed to producing industries for outbound freight, and consuming industries (using REMI’s input-output table) for inbound freight.
  • Farm Output – Reduced output associated with production cost increases for three commodity types: Live animals/fish, Cereal grains, Other agricultural prods.
  • Industry Sales – Ports:  The amount of port revenue assumed to be lost due to import or export freight diversions resulting from PUT impositions.  The amount is calculated as the average revenue per ton of freight for 2019-2021 multiplied by the baseline import or export tonnage for the given trade-commodity flow, multiplied by the percentage of port volume change estimated by an external consultant.
  • Industry Sales – Transportation Industries: The amount of transportation industry revenue assumed to be lost due to import or export freight diversions resulting from PUT impositions.  The amount is calculated as estimated baseline transportation revenue for a given trade-commodity flow, multiplied by the estimated percentage of port volume change.
  • State Government Spending – Applied in each scenario. Increased state government spending is the amount of taxpayer savings that would become tax revenue in the event the preferences were repealed.
Exhibit E.4: REMI Policy variables in Scenario A (transportation industries bear entire increased production cost)
Trade-flow Combination
Policy Variable Import - Within WA Export - Within WA Domestic - Inbound to WA Import - Inbound to WA Export - Inbound to WA Domestic - Outbound from WA Import - Outbound from WA Export - Outbound from WA
Production Cost – Transportation Industries X X X X X X X X
Production Cost - Freight-Dependent Industries
Farm Output
Industry Sales – Ports X X X X
Industry Sales – Transportation Industries X X X X
State Government Spending X X X X X X X X
Source: JLARC staff REMI analysis.
Exhibit E.5: REMI Policy variables in Scenario B (freight-dependent industries bear entire increased production cost)
Trade-flow Combination
Policy Variable Import - Within WA Export - Within WA Domestic - Inbound to WA Import - Inbound to WA Export - Inbound to WA Domestic - Outbound from WA Import - Outbound from WA Export - Outbound from WA
Production Cost – Transportation Industries
Production Cost - Freight-Dependent Industries X X X X X X
Farm Output X
Industry Sales – Ports X X X X
Industry Sales – Transportation Industries X X X X
State Government Spending X X X X X X X X
Source: JLARC staff REMI analysis.

23-05 Final Report: Interstate Transportation

November 2023

Recommendations & Responses

Legislative Auditor's Recommendation

Legislative Auditor's Recommendation: Clarify

The Legislature should clarify the objectives for these preferences. They are no longer necessary to comply with the Constitution because the U.S. Supreme Court has changed its interpretation of the Commerce Clause. The Legislature may have other objectives for the preferences, though it has not stated them in law.

  • If the Legislature has other objectives for these preferences, it should state those objectives and, if applicable, establish measurable criteria. Objectives for similar preferences include: to create and retain jobs, attract and retain businesses, and make Washington competitive with other states.
  • If the Legislature's sole objective for the preferences is to avoid taxing any activity whose taxation is constitutionally prohibited, it should repeal the preferences because a fairly apportioned PUT would be constitutionally permitted. Such a policy change would require a method of apportioning transportation income to activities within the state.

Legislation Required: Yes

Fiscal Impact: Depends on legislative action.

23-05 Final Report: Interstate Transportation

November 2023

Recommendations & Responses

Letter from Commission Chair

23-05 Final Report: Interstate Transportation

November 2023

Recommendations & Responses

Commissioners' Recommendation

The Commission endorses Legislative Auditor recommendation to clarify but the preference should be continued. The Legislature should retain these preferences but clarify the purpose and metrics to aid future reviews. All of the preferences benefit both large and small transportation companies that often operate with relatively low profit margins while still providing family wage jobs. The preferences for transporting Washington commodities directly to a Washington port for export by vessel and transporting Washington agricultural products to an interim storage facility before shipment to a Washington port for export by vessel support the use and viability of the state’s ports. Since Washington’s ports are a key part of the economy, and there is intense competition for port services on the West Coast, the elimination of these preferences could adversely impact port activity.

23-05 Final Report: Interstate Transportation

November 2023

Recommendations & Responses

DOR & OFM Response

23-05 Final Report: Interstate Transportation

November 2023

More about this review

Study questions

Click image to view PDF of proposed study questions

Image of Proposed Study Questions document.