Plan Maturity Measures
Explains some of the risks plans face as they grow and mature over time including enterprise risk, contribution rate volatility, and liquidity risk.
Some risks can emerge just by the nature of a pension plan growing or maturing over time. For example, the more members and annuitants a pension plan has (i.e., as its obligations or contribution requirements grow), the larger it can become as a share of the government enterprise that supports it. In other cases, the larger and more mature a pension plan becomes (i.e., as its assets grow relative to the payroll of contributing members), the more volatile the contribution requirements can become. Both of these outcomes can present “enterprise risk” to the governing entities that sponsor the plan.
To illustrate this point, consider the Public Employees’ Retirement System (PERS), which is the largest Washington State pension plan. Both the state (primarily through the State General-Fund [GF-S]) and local governments support PERS through employer contributions (tax dollars). If employer contribution requirements for PERS grow too large over time, they could “crowd out” other government services. Alternatively, if contribution volatility becomes too significant, it may lead to unaffordable contribution requirements and funding shortfalls. Any funding shortfalls would also serve to increase future contribution requirements.
Affordability and Enterprise Risk Measures
We measure the affordability of Washington State pension plans and the associated enterprise risk by comparing estimates of historical and projected pension contributions paid from the GF-S to the total GF-S budget. In the following graph, the line represents estimated GF-S pension contribution as a percentage of GF-S budget. The vertical bars correspond to the estimated dollar amount paid from the GF-S budget.

The historical percent of GF-S budget that is attributable to estimated GF-S contributions (green line) is expected to continue declining from the peak around Fiscal Year 2020. As discussed in the 2021 Report on Financial Condition and Economic Experience Study , the peak coincides with the highest collected contribution rates for most systems and GF-S pension contributions as a percent of the GF-S budget are projected to become a smaller percent of the state budget as the contribution rates decline. As an example, we expect this ratio to decline when contributions to the Plans 1 Unfunded Actuarial Accrued Liability (UAAL) are reduced or no longer required. As of the June 30, 2022, measurement date, the state contributes more than double the long-term expected percent of GF-S budget.
It is also worth noting that this graph shows the estimated GF-S pension contributions across all plans as a percent of the total GF-S budget. This percentage varies by plan and changes over time. This is illustrated by the pie charts below which highlight, among other things, the arrival and maturation of the newer Plans 2/3 and the decline in Plan 1 UAAL contribution rates. In addition, the charts display Teachers’ Retirement System (TRS) exceeding PERS in percent of GF-S budget due to our higher fund splits assumption even though the retirement system is smaller.

Note: Plans not displayed comprise less than 0.05% of the GF-S budget.
To estimate GF-S contributions, we apply our historical and projected fund split assumptions to the applicable year’s total employer contribution. Our most recent fund splits assumption can be found on our Projections Model and Assumptions webpage. Where available, our comparison relies on GF-S budget information found in the June 2023 Washington State Economic and Revenue Forecast Report.
Contribution Rate Volatility Measures
We measure the volatility risk of pension contributions by determining the ratio of the Market Value of Assets (MVA) to active participant payroll. In general, the higher the ratio, the more sensitive (or volatile) contribution rates are to asset returns that are lower or higher than expected (sometimes referred to as investment losses or investment gains).
To demonstrate this, we use the following example, which is conducted across the pension plans as a whole. At the current ratio for 2022, if assets earn 10 percent less than assumed in a single year without a subsequent and offsetting investment gain, the loss would require an additional contribution of about 3.3 percent for 20 years. If the current ratio were to double in the future, the same asset investment loss would require a contribution of about 6.6 percent for 20 years.
The graph below illustrates that the historical ratio between MVA and Active Participant Payroll across all plans has grown from about 3.8 in 2006 to 5.1 in 2022 and is projected to hold around 5.8 in 2048 (a 14 percent increase from what was observed in 2022).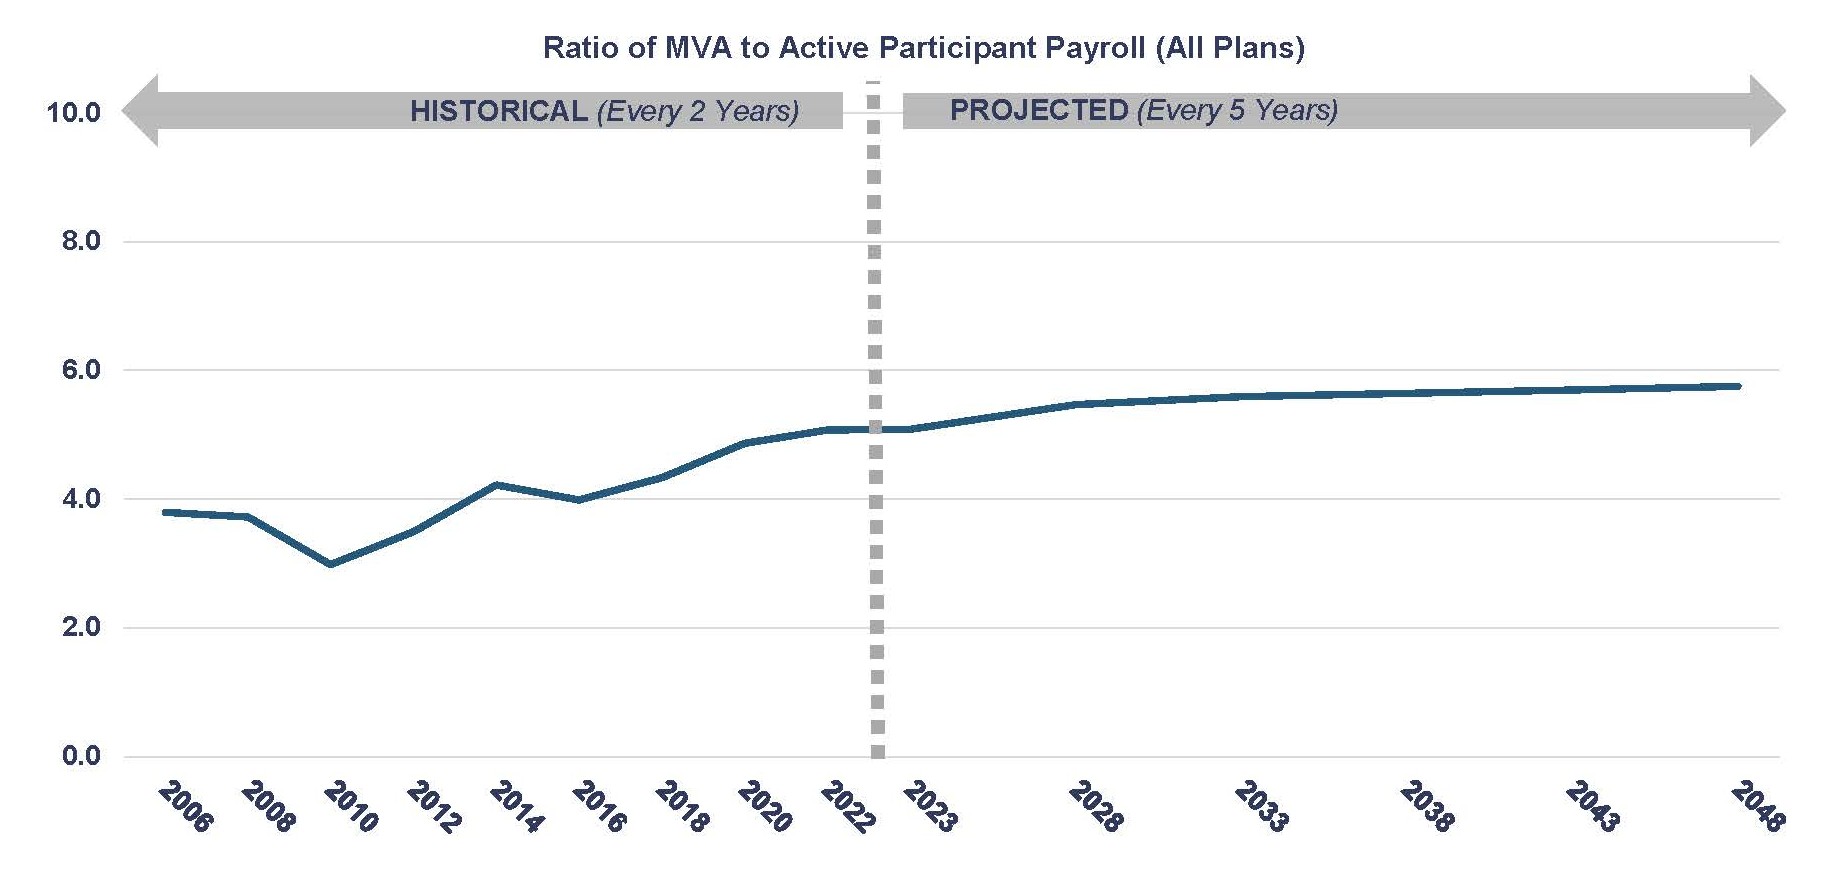
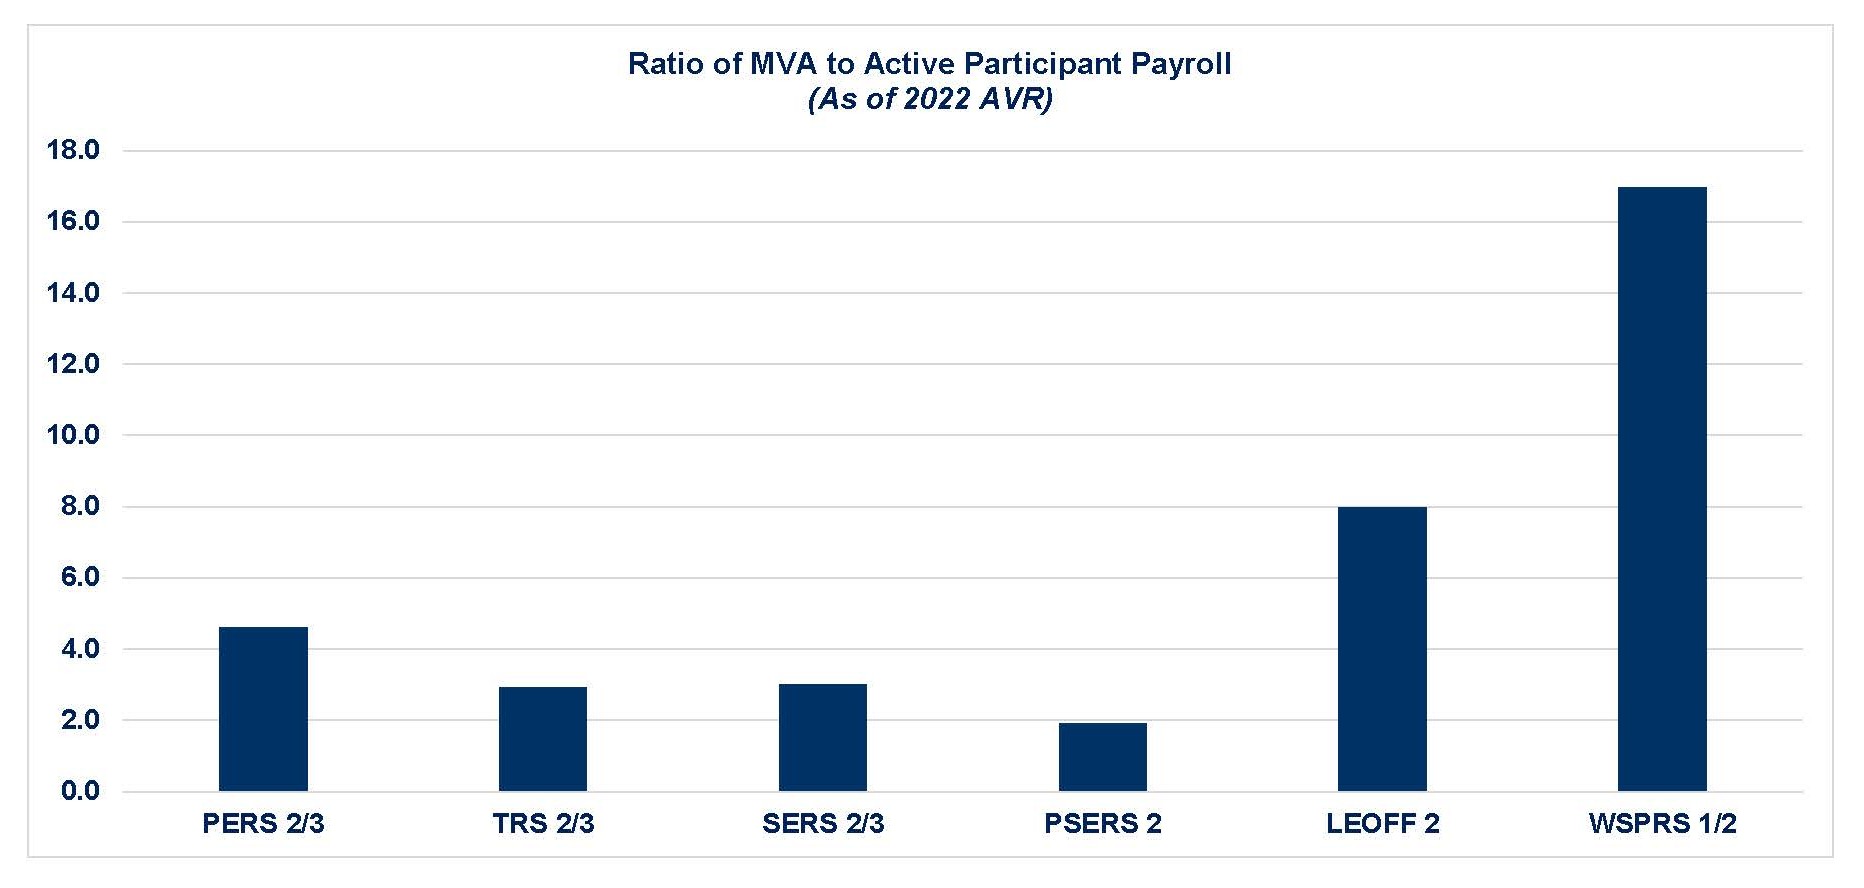
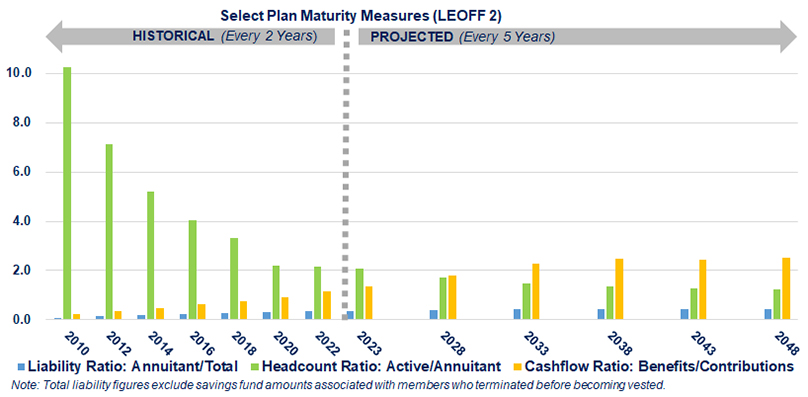
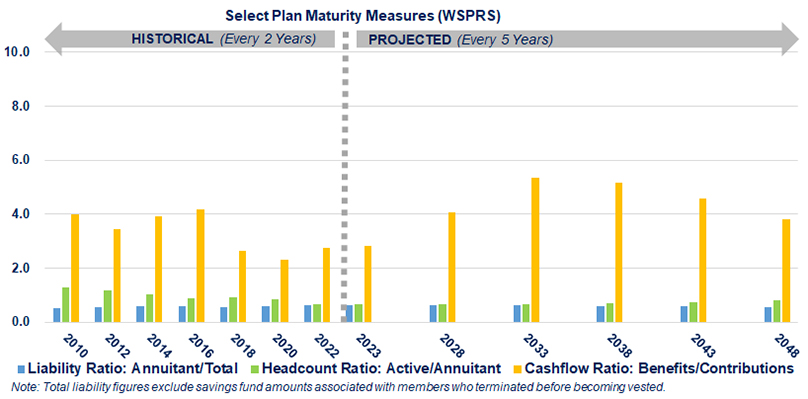
The above graph displays this measure for all plans, but the measure can significantly vary between retirement plans. For additional information, we provided the ratio of MVA to Active Participant Payroll for the Washington State pension plans that are open to new participants. Based on this measurement date, the Law Enforcement Officers’ and Fire Fighters’ (LEOFF) Plan 2 and the Washington State Patrol Retirement System (WSPRS) appear to have the most contribution rate volatility due to investment return experience that does not match expectations. The historical fluctuations in contribution rates for WSPRS reinforces the below chart; however, we do not believe LEOFF 2 is as high of a contribution risk due to its higher funded status and funding policy, which includes a higher minimum rate floor than the other plans.
Other Plan Maturity Measures
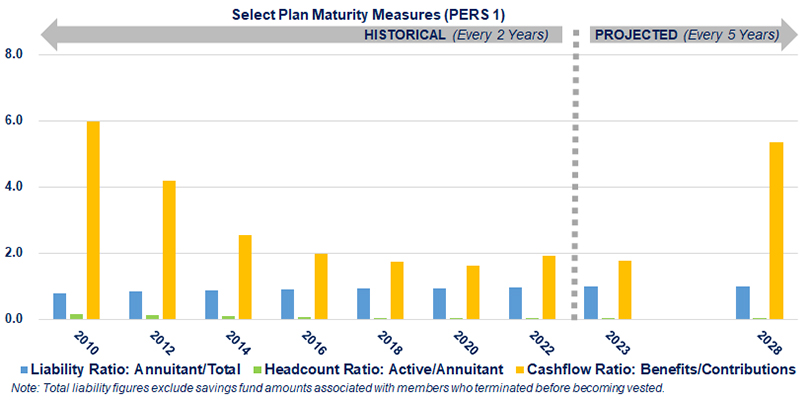
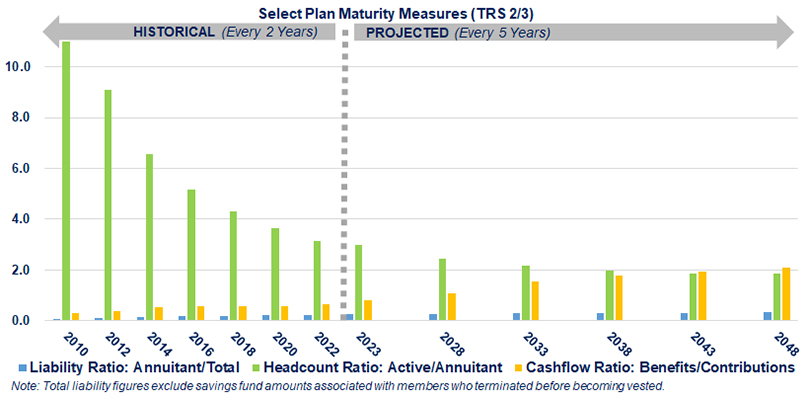
As a pension plan matures, more members move from active to inactive status. While in active status, members generally contribute to the pension plan. While in inactive status, members stop contributing to the plan and either are in receipt of a pension benefit (drawing down plan assets) or have a vested right to receive a future pension benefit.
The relative maturity of a pension plan in this area can have implications on future contributions in two areas:
- A reduction in the number of active members and their employers, relative to inactive members, subsidizing the cost of the plans. Dependent upon plan experience, this can increase or decrease the future contributions of plan members/employers. For example, consistent lower/higher than expected investment returns will be shared over fewer contributing members and employers and increase/decrease future contributions.
- A reduction in the plan’s cash flow (annual contributions minus annual benefit payments), thus increasing the liquidity needs of the plan. The need for increased liquidity may lead to a revised asset allocation. The asset allocation for a mature plan could have an emphasis on asset classes with shorter investment horizons. An asset allocation with more liquid assets would have a lower expected return as a tradeoff for the less investment risk. Additional information on liquidity can be found further below.
Generally, these risks increase for closed plans (closed to new members) and have less relevance for open plans unless they become significantly underfunded.
Maturity measures by plan


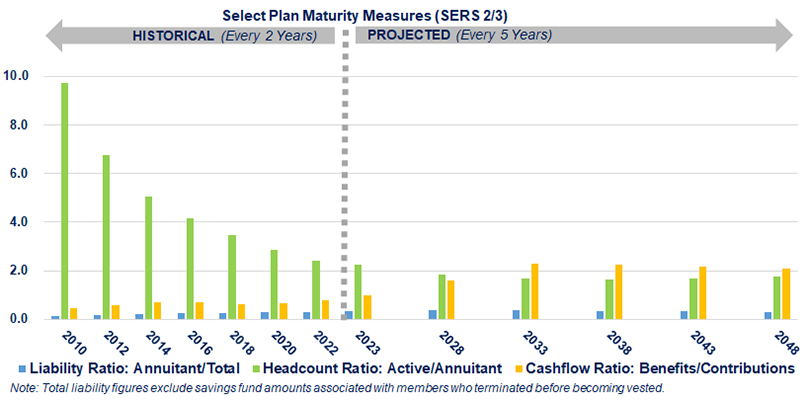
Liquidity Risk Measures
The Washington State Investment Board monitors the ongoing cash flow needs of the Commingled Trust Fund (CTF) (CTF) and sets the asset allocation for the CTF with consideration of the expected cash flows. One common measure of liquidity needs is the ratio of net cash flow (contributions less benefit payments) to the MVA, which we look at across all retirement plans in the graph below. The vertical bars in this graph correspond to the left axis and are generally negative dollar amounts which indicates benefit payments exceed contributions, while the line on the graph corresponds to the right axis and denotes this same dollar amount as a percentage of the MVA.

The CTF cash flow measurement in the above graph does not account for investment returns which, as discussed in the Risk Measurements for Washington’s Public Pension Plans section, have comprised approximately 70 percent of the pension fund’s total income over the past 20 years. When you exclude expected investment returns from this measure, we observe a negative cash flow measure for the CTF. If the measure becomes significantly more negative, as a percentage of the MVA, it indicates increased liquidity needs for the CTF. That outcome would likely result in a change in asset allocation, a lower assumed rate of investment return, and an increase in future contribution requirements.
When considering liquidity risk, it is also important to note that the open plans in the CTF provide liquidity for the closed plans invested in the same CTF. More specifically, the closed plans are shrinking and need to sell assets to pay benefits whereas the open plans are growing, taking in a higher proportion of contributions compared to benefit payments, and need to buy more illiquid assets in the CTF. In this circumstance, the open plans can buy the closed plans shares/units of the CTF invested in illiquid assets. This allows the closed plans to remain invested in the CTF and benefit from higher investment rates of return without the liquidity risk they would face if invested in a separate trust fund with the same asset allocation.
The graphs below help to illustrate this dynamic by comparing the contributions, benefit payments, and net cash flow (or contributions less benefit payments) between the closed plans and the open plans.

