
Inflation data

Historical Consumer Price Index (CPI) data

Consumer Price Indexes

Retirement benefit Cost-Of-Living Adjustments (COLAs) are determined by the consumer price indexes calculated and maintained by the U.S. Bureau of Labor Statistics (BLS). The Consumer Price Index (CPI) is a measure of the changes in prices of all goods and services purchased for consumption by households. We update this page in the spring of each year.

Separate indexes are produced for regional areas and the nation as a whole. Based on statute, the indexes the Washington State retirement systems rely on is the "urban wage-earners and clerical workers" (CPI-W). The national CPI-W index below is used to determine annual benefit increases for the Judicial system and the Volunteer Fire Fighters and Reserve Officers system. The regional (Seattle area) CPI-W index is used by all other eligible plans administered by the Department of Retirement Systems; please see our COLA webpage for further details. 
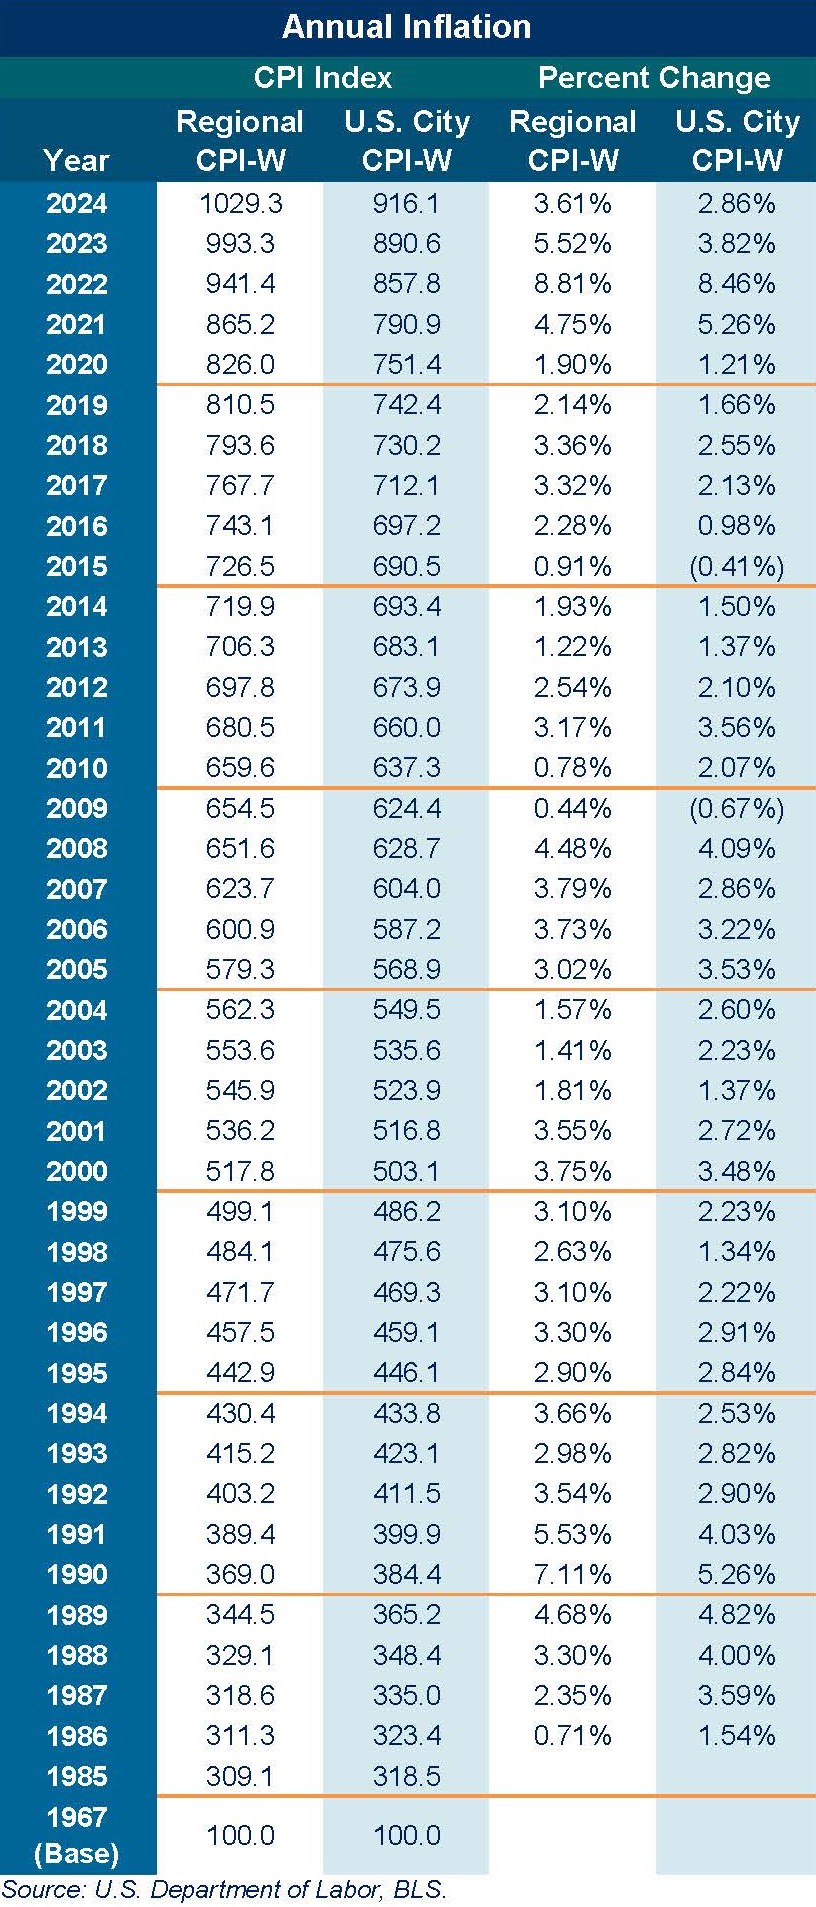
Annual Inflation

Year

Regional CPI-W

(CPI Index)

U.S. City CPI-W

(CPI Index)

Regional CPI-W

(Percent Change)

U.S. City CPI-W

(Percent Change)

2025 1055.5 939.1 2.55% 2.51%
2024 1029.3 916.1 3.61% 2.86%
2023 993.3 890.6 5.52% 3.82%
2022 941.4 857.8 8.81% 8.46%
2021 865.2 790.9 4.75% 5.26%
2020 826.0 751.4 1.90% 1.21%
2019 810.5 742.4 2.14% 1.66%
2018 793.6 730.2 3.36% 2.55%
2017 767.7 712.1 3.32% 2.13%
2016 743.1 697.2 2.28% 0.98%
2015 726.5 690.5 0.91% (0.41%)
2014 719.9 693.4 1.93% 1.50%
2013 706.3 683.1 1.22% 1.37%
2012 697.8 673.9 2.54% 2.10%
2011 680.5 660.0 3.17% 3.56%
2010 659.6 637.3 0.78% 2.07%
2009 654.5 624.4 0.44% (0.67%)
2008 651.6 628.7 4.48% 4.09%
2007 623.7 604.0 3.79% 2.86%
2006 600.9 587.2 3.73% 3.22%
2005 579.3 568.9 3.02% 3.53%
2004 562.3 549.5 1.57% 2.60%
2003 553.6 535.6 1.41% 2.23%
2002 545.9 523.9 1.81% 1.37%
2001 536.2 516.8 3.55% 2.72%
2000 517.8 503.1 3.75% 3.48%
1999 499.1 486.2 3.10% 2.23%
1998 484.1 475.6 2.63% 1.34%
1997 471.7 469.3 3.10% 2.22%
1996 457.5 459.1 3.30% 2.91%
1995 442.9 446.1 2.90% 2.84%
1994 430.4 433.8 3.66% 2.53%
1993 415.2 423.1 2.98% 2.82%
1992 403.2 411.5 3.54% 2.90%
1991 389.4 399.9 5.53% 4.03%
1990 369.0 384.4 7.11% 5.26%
1967 (Base) 100.0 100.0    

Source: U.S. Department of Labor, BLS.

An unhandled error has occurred. Reload 🗙