Risk Assessment
The risk assessment helps stakeholders understand the potential likelihood of adverse outcomes occurring in the state pension systems.
Introduction
Welcome to the Office of the State Actuary’s risk assessment. This webpage summarizes the results of possible future funding outcomes for the Washington State pension plans administered by the Department of Retirement Systems. We created this risk assessment to help stakeholders understand the potential likelihood of adverse outcomes in the plans under current law.
Risk assessments are an important consideration when viewing valuation and projection results. The Background section of our most recent Assumptions and Methods for Valuation Projections Model webpage summarizes the difference between valuations and projections. Both valuations and projections are valuable tools, but they rely on fixed assumptions that could play out differently than we expect. Risk assessments highlight the impacts on key funding measures, such as funded status and contribution rates, when actual plan experience varies from assumed plan experience.
This assessment focuses on the uncertainty in future plan experience related to investment returns. Investment risk is one of the greatest risks to the affordability and solvency of the Washington State pension plans, because their funding relies heavily on investment returns. Over the past 20 years across all plans, investment returns have comprised roughly 70% of the pension fund’s total income. If investment returns are lower than expected, it often results in an increase to member and employer contribution rates to offset the lower than assumed investment assets.
The risk measures presented below demonstrate the likelihood of 2,000 simulated scenarios resulting in the identified risk emerging when the investment experience varies annually. Using the drop-down options, readers can choose to see a risk measures for Open Plans - Funded Status, Open Plans - Contribution Rates, and Closed Plans - Funded Status Measure.
This webpage was last updated in the winter of 2024 using the results of our June 30, 2023, Valuation Projections model. See the Notes and Disclosures section at the bottom of this webpage for more information on our stochastic modeling assumptions and methods, as well as information on the use of this risk assessment. For information on other types of pension risk, see our Commentary on Risk webpage.
Measures and Assessment
Open Plans - Funded Status Measure
Funded status is an annual point-in-time measurement that helps explain the health of a pension plan. The measure represents the portion of actuarial accrued liabilities, or earned benefits, covered by the actuarial value of assets. A funded status less than 100% typically means an established plan is behind schedule on its funding goals and usually requires higher short-term contributions. See the Funded Status section of the most recent Actuarial Valuation Report (AVR) for more information including the current funding status of each plan.
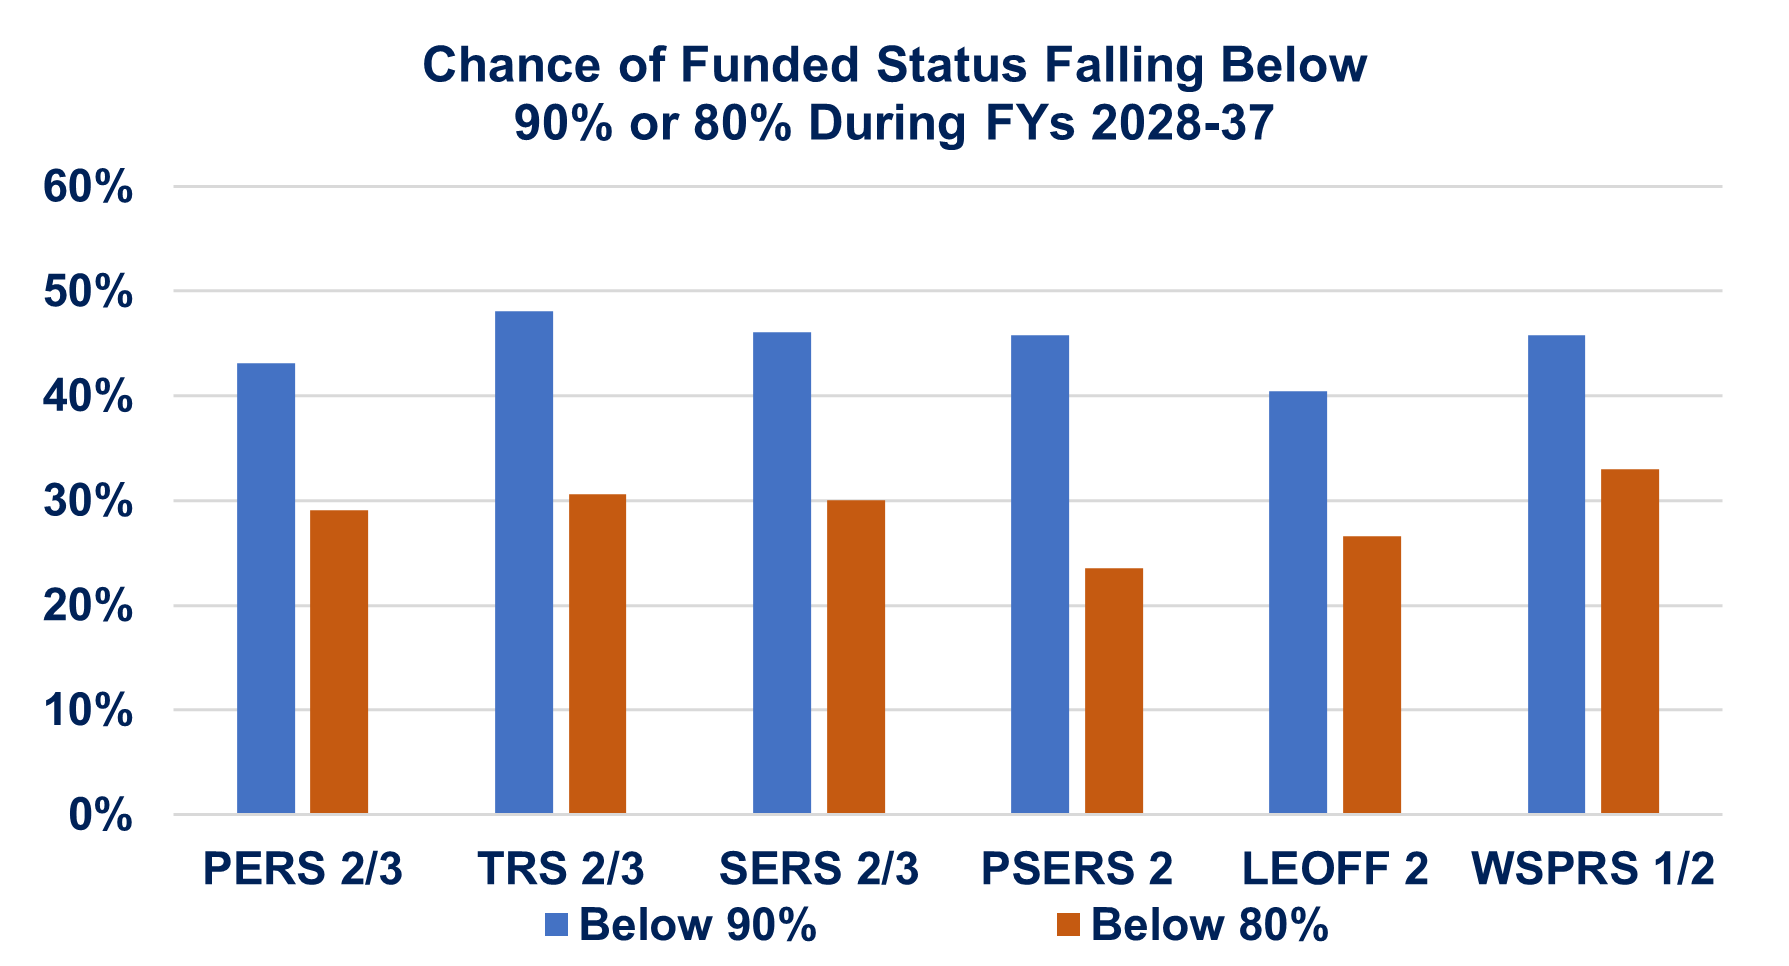
This risk measure estimates the chance that funded status will fall below 90% or 80% anytime in the ten-year period following the biennium of currently adopted contribution rates. We include both 90% and 80% funded status metrics to give the reader an idea of the likelihoods of plans falling below various thresholds. In order for a plan to fall below 80% funding status, the plans would need to see relatively larger (or more frequent) occurrences of lower than assumed investment returns.
If future plan experience matches our assumptions and all actuarially determined contributions are collected, funded status in all open plans is projected to exceed 100% by 2028 and remain above 100% thereafter. As such, the impact of downside investment risk represents a significant change in the plans’ projected future financial condition. For context, the open plans dip below the 90% funded status metric when investment returns average about 5.5% to 6.0% annually, while an investment return average of 4.5% to 5.0% triggers the 80% metric in all open plans. In response to these scenarios, member and employer contribution rates would be expected to increase to make up for the lower than assumed investment returns.
Open Plans - Contribution Rate Measure
Washington state utilizes systematic actuarial funding to finance its pension obligations. Under this funding approach, pension benefits are paid for by a combination of investment earnings and contributions made regularly over time. In order to meet plan funding goals, it’s important to review and update contribution rates regularly for changes in plan assumptions, provisions, and experience. The Pension Funding Council and the Law Enforcement Officers’ and Fire Fighters’ (LEOFF) Plan 2 Retirement Board consider updates to contribution rates for their respective areas of governance every two years.
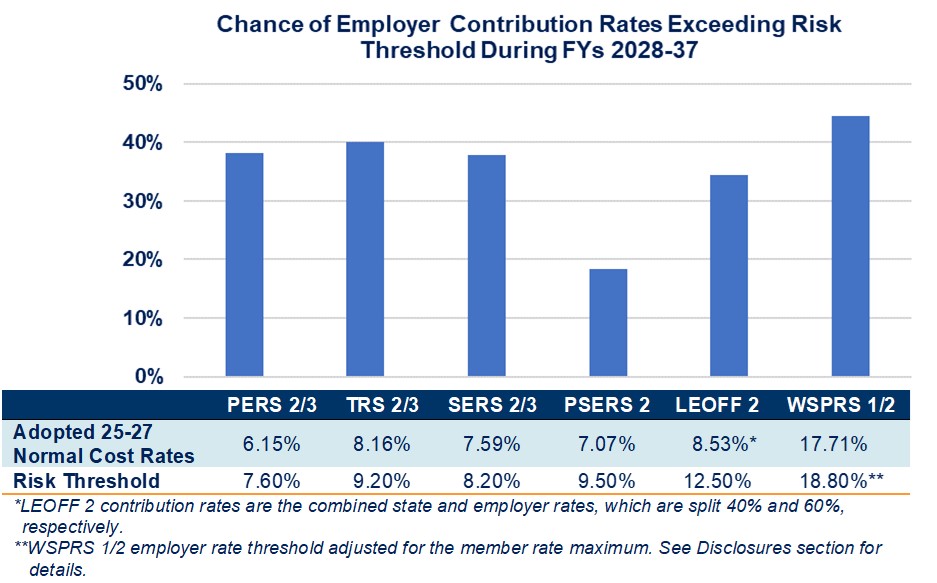
This risk measure displays the probability estimated by our model that employer normal cost contribution rates will exceed a certain plan-specific risk threshold anytime in the ten-year period following the biennium of currently adopted contribution rates. We estimate contribution rates at or above these thresholds could create a challenging affordability environment for the state pension systems. See the Notes and Disclosures section at the bottom of this webpage for information regarding the development of these risk thresholds.
All plans, except for the Public Safety Employees’ Retirement System (PSERS), have a greater than 30% chance of their contribution rates exceeding the risk threshold. These high contribution rate outcomes are correlated with the low funded status outcomes from the Open Plans - Funded Status Measure. PSERS displayed a lower probability of exceeding the threshold because the plan has a relatively less mature membership, dampen the impact from lower than assumed investment experience.
Closed Plans - Contribution Rate Measure
Current law funding policy for the Public Employees' Retirement System (PERS) and the Teachers’ Retirement System (TRS) Plan 1 includes two sets of rates: (1) the Base Unfunded Actuarial Accrued Liability (UAAL) rate and (2) the Plan 1 Benefit Improvement rate. The Base UAAL rate is collected until the unfunded liability, not related to benefit improvements, is eliminated. The Base UAAL rate could reemerge if negative plan experience necessitates additional funding. The Plan 1 Benefit Improvement rate is paid for a fixed ten-year period for each benefit improvement regardless of plan experience. Base UAAL rate and Plan 1 benefit improvement rates for PERS 1 are charged to all PERS, the School Employees' Retirement System (SERS), and PSERS employers, while rates for TRS 1 are charged to all TRS employers.
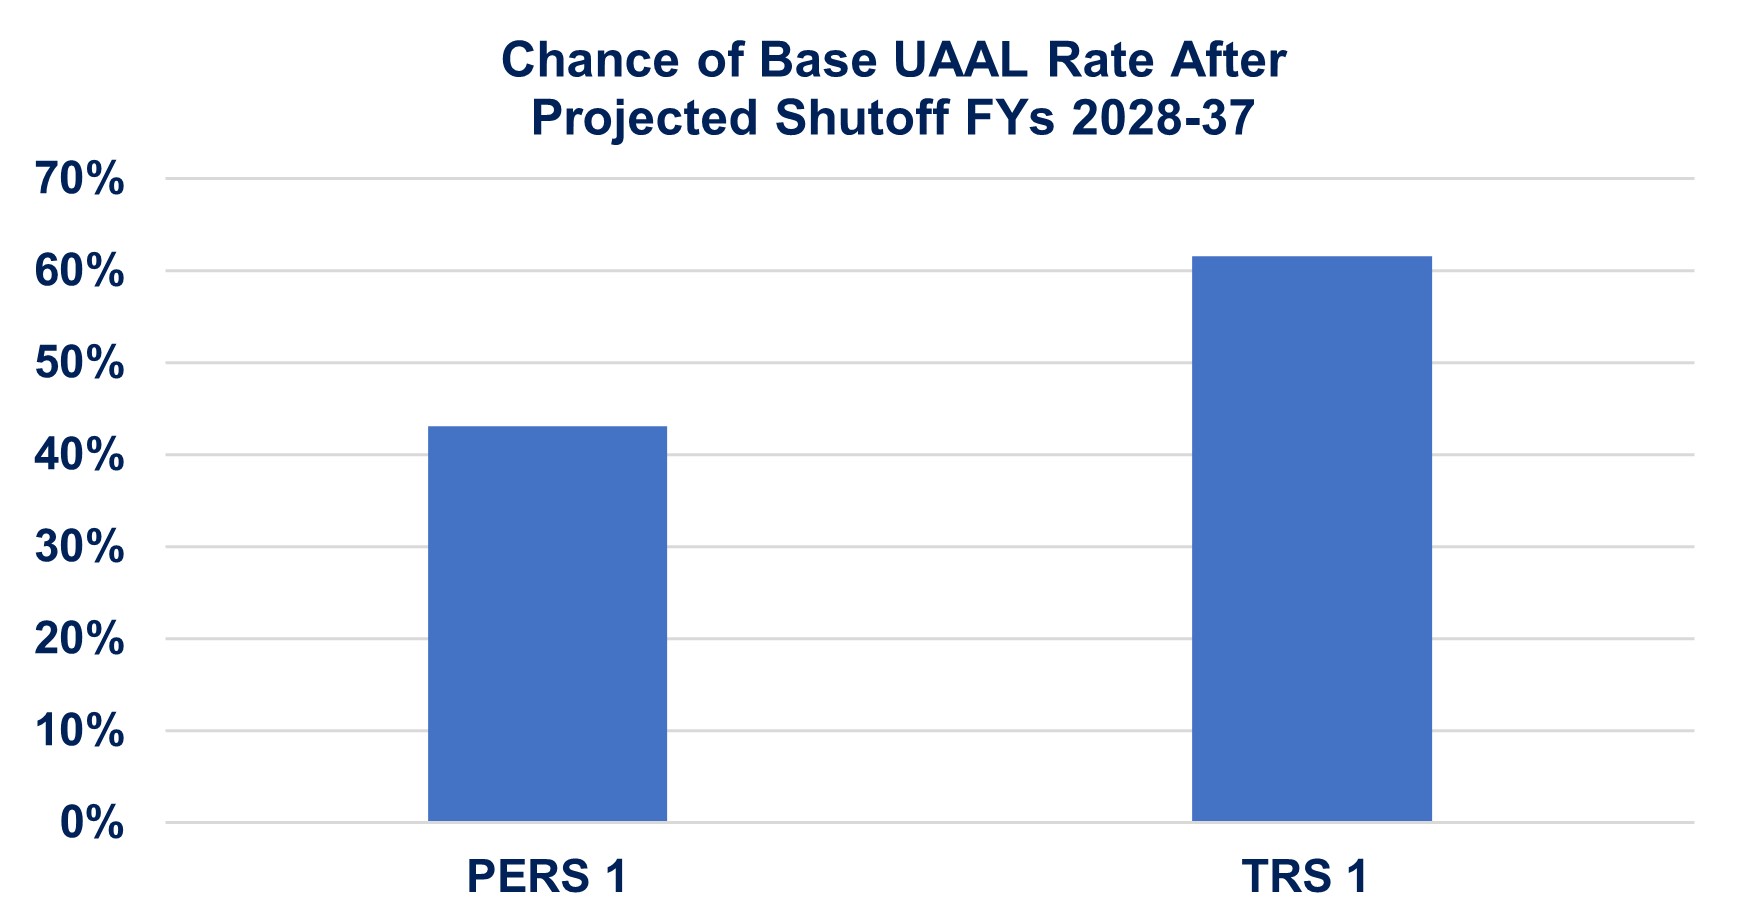
Our most recent Projections Model calculated an expected Base UAAL rate shutoff beginning Fiscal Year (FY) 2028 for both PERS and TRS Plan 1. Therefore, we consider this risk measure over a ten-year period starting in 2028. This risk measure focuses on the chance of additional Base UAAL rate contributions beyond the expected shutoff year.
Our model estimates that the chance of additional contribution rates during 2028-37 is roughly 40% for PERS 1 and 60% for TRS 1 under current law funding policy. The adopted contribution rates through FY 2027 target full funding of plan liabilities under current assumptions. This funding strategy does not include a buffer for investment return experience below the assumed return of 7.00 percent. Therefore, any negative investment experience that emerges in our stochastic model will require additional contribution rates to regain full plan funding.
Notes and Disclosures
This section contains the assumptions and methods relied on for these risk measures and other important disclosures.
Assumptions and Methods
- This risk assessment is based on the 2023 Valuation Projections Model data, assets, assumptions, and methods. We believe this information is reasonable for use in this risk assessment, but the use of another set of data, assets, assumptions, and methods may also be reasonable and may produce different results.
- The Valuation Projections Model relies on a Monte Carlo simulation of 2,000 randomized investment returns, derived from a one-year investment return distribution provided by the Washington State Investment Board. See the Economic Assumptions section of the Projections Model webpage for details.
- This risk assessment only considers the impact of deviations in future investment experience. Deviations in other plan experience could also materially impact funding measures. For more information regarding some of these risks, see the Commentary on Risk webpage.
- To calculate the contribution rate risk thresholds, we relied on the Normal Cost rate of the Entry Age Normal Cost Method (EANC) from the 2023 AVR and increased that rate by 25%.
- The threshold for the Washington State Patrol Retirement System (WSPRS) is calculated in the same manner and includes an additional component for the difference in 125% of the EANC rate and the member contribution rate maximum.
These risk measures were developed to inform stakeholders of the potential likelihood of adverse outcomes in the state retirement systems. Please do not use this information for other purposes.
We intend to update this risk assessment in the fall of each year to reflect our latest actuarial valuations. At that time, any previous versions of this webpage will become outdated, and we advise you to not rely on those outdated results.
The undersigned, with actuarial credentials, meet the Qualification Standards of the American Academy of Actuaries to provide these actuarial opinions. While this webpage is intended to be complete, we are available to offer extra advice and explanations as needed.